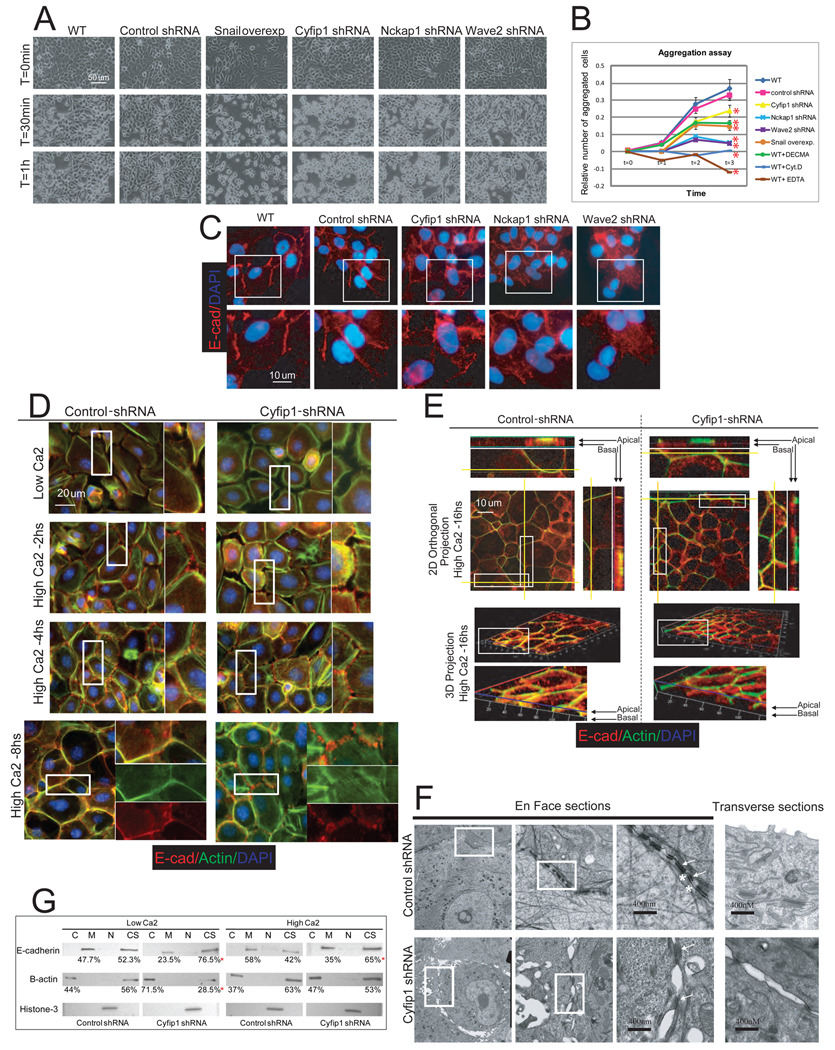
Figure 4. Silencing of WAVE complex components reduces cell-cell adhesion.
(A) Representative snapshot from supplementary movies 1A-1F after EDTA (5mM final concentration) was added to equally confluent MCF-10A cultures. (B) Aggregation experiment showing the percentage of aggregates formed during 3 hours. MCF-10A cells where actin dynamics (cytochalasin-D, 1ug/ml) or E-cadherin mediated adhesion (5mM EDTA,10ug/ml of DECMA E-cadherin blocking antibodies, and Snail-overexpressing cells) was abolished represent controls. The red asterisks indicate p values<.05 (T-test of three replicas) when the aggregation values after 3 hours were compare with wild type cells. (C) Immunofluorescence showing E-cadherin and nuclear staining in controls and knock-down MCF-10A cells. Through the entire figure magnified panels represent images of the selected area (white rectangle). (D) Immunofluorescence showing the development of cell-cell adhesion in control and Cyfip1 knock-down keratinocytes after calcium exposure (2, 4 and 8 hours)..(E) Immunofluorescence of control and Cyfip1 knock-down keratinocytes 16 hours after calcium exposure. 4X magnified images of selected areas together with 2D orthogonal projections (yellow lines) are shown on the side of the upper half of the figure. A 3D reconstruction of the same keratinocyte layer is shown in the lower half. 4X magnified images of selected areas are displayed below. (F) The composition shows structural studies (EM) of control and Cyfip1 knock-down keratinocytes 16 hours after calcium switch. En Face sections present three 10X consecutive magnifications of the same area. Arrows indicate desmosomes, and asterisks indicate adherence junctions. The transverse section shows the apical part of two cells from the same cultures shown En Face. (G) Distribution of E-cadherin and B-actin in different fractions, cytoplasmic (C), membrane (M), nuclear (N) and cytoskeleton (CS) of control and Cyfip1 knocked-down cells growing in low and high calcium media. The numbers below the blots represent the average of the quantitative value of bands in the blots from 3 independent experiments. The red asterisks in (B) and (G) represent p values<.05 (T-test of three replicas) when the values from knock-down cells were compared with controls.

