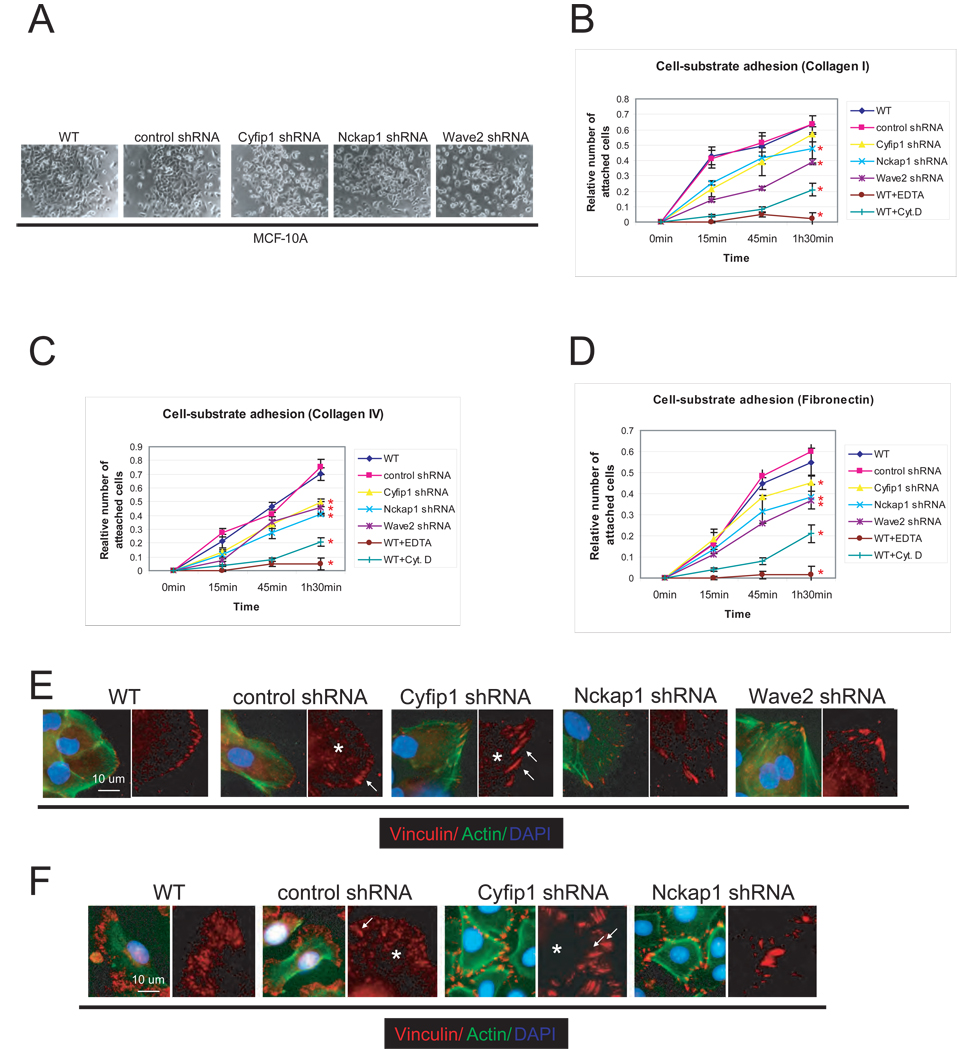
Figure 5. Silencing of WAVE complex components reduces epithelial cell-ECM adhesion.
(A) Representative image of the attachment and spreading of MCF-10A WAVE knock-down cells 6 hours after plating. Kinetics of adhesion of cells from panel (A) in different ECM substrates, (B) Collagen-I, (C) Collagen-IV, (D) Fibronectin. As a negative control, wild-type cells were plated in the presence of 5mM of EDTA (WT+EDTA). The graphics also show the attachment kinetics of wild-type cells in the presence of an inhibitor of actin polymerization, Cytochalasin D, 2µgr/ml (WT+CytD). Error bars show standard deviation from the mean (n=3). Red asterisks indicate differences statistically significant (T-test, p<.05) compared with WT. Notice that although the p value for Cyfip1 knock-down in panel B is not significant, however it was <.1. Immunofluorescence studies showing the distribution and morphology of focal adhesions, labeled with anti-Vinculin antibody, in knock-down MCF-10A cells (E) and keratinocytes (F). The arrows indicate the focal contacts and the asterisks the focal complexes.

