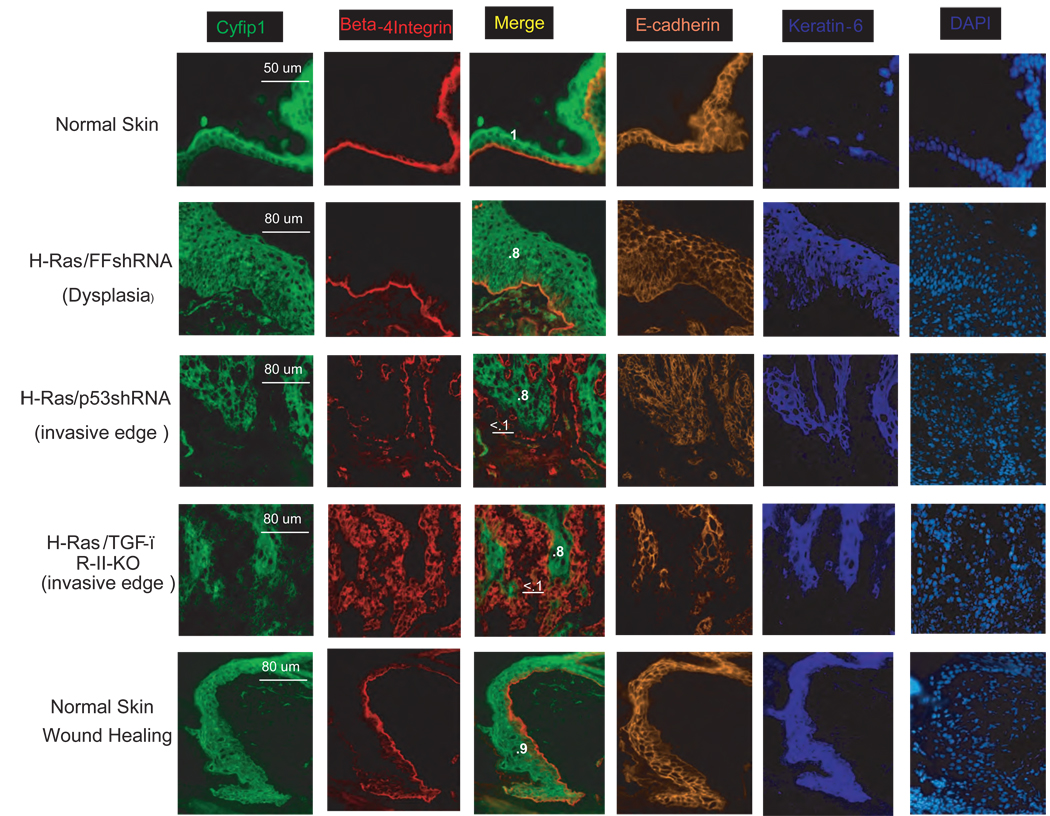
Figure 7. Down-regulation of Cyfip1 occurs during invasion in vitro and in vivo.
Immunofluorescence staining comparing the expression and distribution of Cyfip1 and different characteristic markers of the epidermis, β-4 integrin and E-cadherin is shown. A continuous β-4 integrin staining is an indication of intact epidermal/dermal boundaries (Normal skin, dysplasia and wound healing). In contrast, patched and disorganized staining reflects invasion of tumor cells into the stroma (invasive edges). In this model keratin-6 is a marker that labels proliferating epidermis. Quantitative data comparing the expression of Cyfip1 at the leading edge of the invasion (underlined) and inside of the tumor (bold) are provided. The raw values were double normalized; first, internally to the staining of Beta-4 integrin and then, to the value of the normal skin, and these have been included in the figure.

