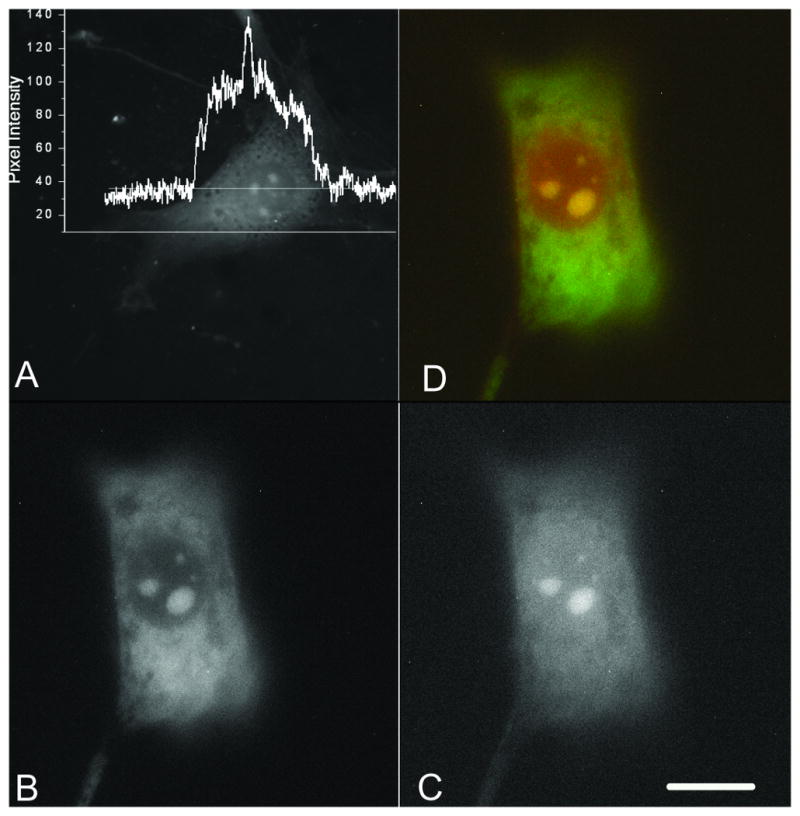
Figure 1.

Emission from formaldehyde-fixed NIH 3T3 cells loaded with 100 mM silver nitrate for 20 hrs. A) Fluorescence image; the inset is the intensity profile along the line drawn across the cell. Scale bar: 30 μm. B) to D) Colocalization of silver and SYTO ® RNASelect staining. B) emission from RNASelect fluorescence (green channel), C) emission from silver clusters (red channel), D) merge of B) and C).
