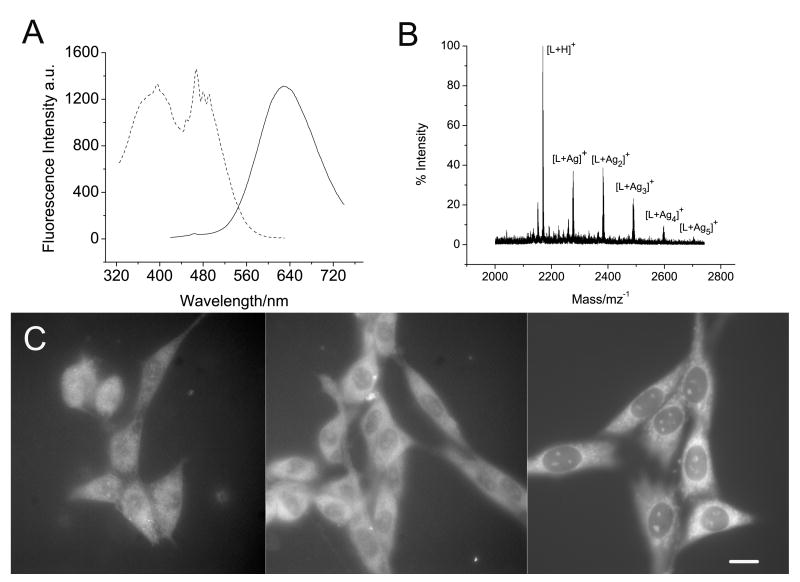
Figure 3.
Photophysics of P3-Ag and its cell loading. A) Emission and excitation spectra of aqueous P3-Ag solution. Emission (solid) was excited at 400 nm, and excitation (dotted) was detected at 630 nm. B) MALDI mass spectrum of P3-Ag. C) Fluorescence images of NIH 3T3 cells loaded with P3-Ag (0.5 mg) Left) in DMEM at 37 °C and 5% CO2, Center) in DMEM at 4 °C, and Right) methanol-fixed NIH 3T3 cells loaded with P3-Ag in DMEM at r.t. incubation time: 1 hr. Under these imaging conditions, no detectable emission from the control cells without Ag nanoclusters is observed (not shown). Scale bar 30 μm.

