Figure 2.
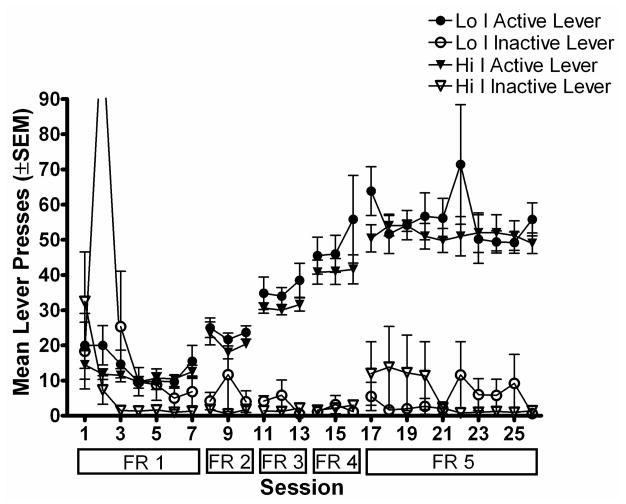
Figure 2a. Mean total number of lever presses during the session is plotted as a function of session during acquisition of MPH self-administration. Filled symbols show lever presses on the active lever and open symbols show lever presses on the inactive lever. Circles show data from the Lo I group and triangles show data from the Hi I group. Error bars show the standard error of the mean. Boxes below the x-axis show the FR value in effect during each session. Note that the off-scale point for inactive lever presses for the Lo I group during the second session was due to one subject pressing the inactive lever 652 times.
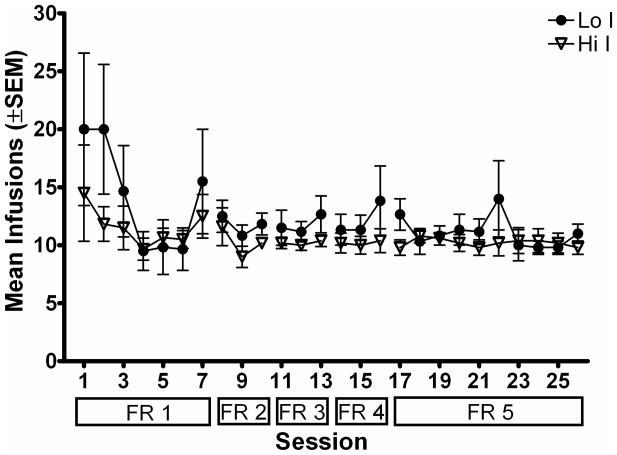
Figure 2b. Mean total number of infusions earned during the session is plotted as a function of session during acquisition of MPH self-administration. Filled circles show data from the Lo I group and open triangles show data from the Hi I group. Other details are as in Figure 2a.


