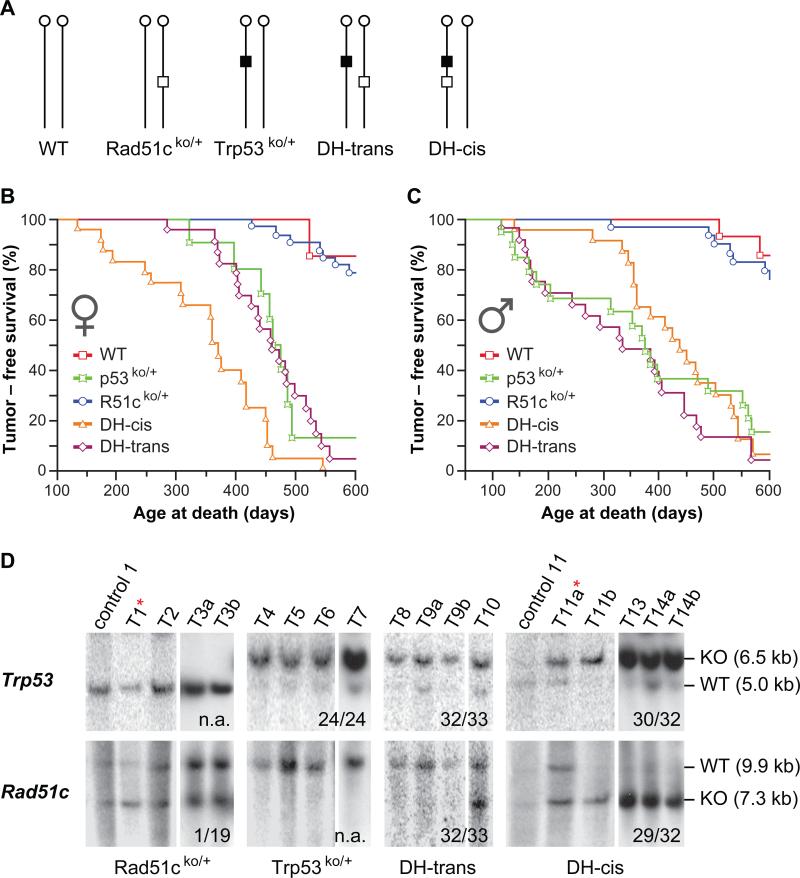
Figure 3. Interaction between Rad51c and Trp53 in mouse tumorigenesis.
(A) Schematic illustration of the five genotypic mouse cohorts used in the study. Vertical lines with a circle at the top indicate mouse chromosome 11 with a centromere. Open box specifies a mutant Rad51c allele. Closed box represents a mutant Trp53 allele. (B and C) Kaplan-Meier plot showing tumor-free survival for each group separately for females (B) and males (C). Statistical evaluation of these data is shown in Table 1. (D) Southern blot analysis of tumor tissues for LOH at Trp53 locus (upper panel) and Rad51c locus (lower panel). Animal genotype is indicated at the bottom. “T” marks tumor samples T1, sarcoma, NOS, muscle; T2, B-cell Lymphoma; T3a, Pituitary adenoma; T3b Hemangiosarcoma; T4, sarcoma, NOS, muscle; T5 rhabdomyosarcom, muscle; T6, sarcoma, NOS, muscle; T7, mammary adenoma; T8, rhabdomyosarcoma, muscle; T9a, rhabdomyosarcoma, muscle; T9b, rhabdomyosarcoma, muscle. T10, cholangiosarcoma,liver; T11a, osteosarcoma, vertebra; T11b, myoepitheliaoma, salivary gland; Letters a and b after the tumor number, indicate that the tumors are from the same animal. Control lanes show tail DNA samples for the tumor samples in the following lane. The only tumor from Rad51cko/+ animal showing LOH for Rad51c and another tumor from DH-cis animal showing LOH for Trp53 but not Rad51c is indicated with an asterisk (*) next to tumor number. Faint wild-type bands observed in LOH samples are likely be due to the presence of contaminating normal infiltrating inflammatory cells. Numbers at the bottom of each panel indicate the number of samples showing LOH relative to the total number of tumor samples tested. n.a., not applicable.

