Abstract
Protein modifications such as phosphorylation are often studied by two-dimensional gel electrophoresis since the perturbation in the protein’s pI value is readily detected by this method. It is important to be able to calculate the changes in the pI values that specific post-translational modifications cause and to visualize how these changes will effect protein migration on 2D gels. To address this need, we have developed ProMoST. ProMoST is a freely accessible web based application that calculates and displays the mass and pI values for either proteins in the NCBI database identified by accession number or from submitted FASTA format sequence.
Keywords: Two-dimensional gel electrophoresis, protein modification, phosphorylation
1. Introduction
One of the most successful methods for detecting and analyzing protein posttranslational modifications (PTMs) has been two-dimensional gel electrophoresis (2D-GE). Since many PTMs, such as phosphorylation, introduce charged groups into the protein, there is often a detectable change in the position of the protein on a 2D gel. Although the change in the mass of the protein due to the PTM is often too small to be easily detected by standard sodium dodecyl sulfate polyacrylamide gel electrophoresis (SDS-PAGE), the modification can cause a change in the net charge of the protein leading to a change in the isoelectric point, or pI of the protein. The first dimension of the 2D gel, usually shown horizontally, is the isoelectric focusing dimension; changes in protein pI’s are reflected as changes in the horizontal position of the protein spot within the 2D pattern of spots. Often it is observed that there are ‘trains’ of spots on the gel that are presumably formed by multiple versions of the same protein that differ in isoelectric point due to increasing numbers posttranslational modifications such as phosphorylation or deamidation (1, 2).
Although 2D-GE is a sensitive method for determining that there are posttranslationally modified forms of proteins present, it does not directly indicate what the modification is or how many of the residues in the protein are modified. Since proteins vary greatly in their ability to buffer the change in pI due to posttranslational modifications, to examine these results more closely it is necessary to calculate the predicted pI changes caused by the modification in the context of the protein sequence.
To meet this need, we have developed ProMoST, a web based application that allows users considerable freedom in calculating the pI values of modified and unmodified proteins (3). ProMoST has predefined modifications so that casual users are able to rapidly determine the predicted pI values of modified proteins and peptides. In addition, ProMoST also provides additional options for more advanced users allowing them to define additional custom modifications, change the pKa values for the defined modifications and even make changes to the default pKa values for charged amino acids used to calculate pI values. The results of the calculations can be displayed both in a tabular format as well as in a graphic representation of the migration of the protein on a 2D gel.
1.1 pI
The pKa values of the side chains of the twenty common amino acids that comprise most proteins vary from approximately pH 2.8 to pH 11.2 (4). Three amino acids are positively charged under physiological conditions (lysine, arginine, and histidine) are termed basic amino acids and two amino acids are negatively charged under physiological conditions (glutamic acid and aspartic acid) and are termed acidic amino acids. In addition, the amino (N) and carboxyl (C) termini of the protein can also be charged. To determine the total charge of a protein at a given pH, the fractional number of positive and negative charges for each of the amino acids in the protein’s sequence is determined and sum of the fractional charges is equal to the charge on the protein.
The isoelectric point, or pI of the protein is the pH value at which the total charge on the protein is zero. At this pH value the negative and positive charges of the protein are equal and the protein is at neutral charge. The pI of the protein therefore gives an indication of whether the protein will carry a net positive or negative charge under physiological conditions. Proteins that have a pI > 7.0 are considered to be basic proteins and proteins that have a pI < 7.0 are considered to be acidic proteins.
In addition to giving an indication of the charge of the protein, the pI is also a good indicator of the solubility of the protein at a given pH. One of the most important aspects of a protein’s physiochemical properties that determines solubility is its charge. Thus at a pH equal to the pI of the protein, it is uncharged and therefore it is usually the least soluble. Manipulating protein charge, either by changing pH or by adding salt to neutralize charge is the basis for many of the early methods for protein purification by differential solubility (5).
The loss of charge at a protein’s pI is also part of the fractionation process during the first dimension of the 2D gel that is based on isoelectric focusing (6). Proteins are introduced to a strip on which a pH gradient has been established and in the presence of a high electric field they migrate to the position on the strip at which the protein has a net neutral change and it stops migrating. This pH value corresponds to the pI of the protein. Thus the final migration position of the protein in the horizontal dimension of the 2D gel is determined by the pI value of the protein.
1.2 Modifications and mutations change pI
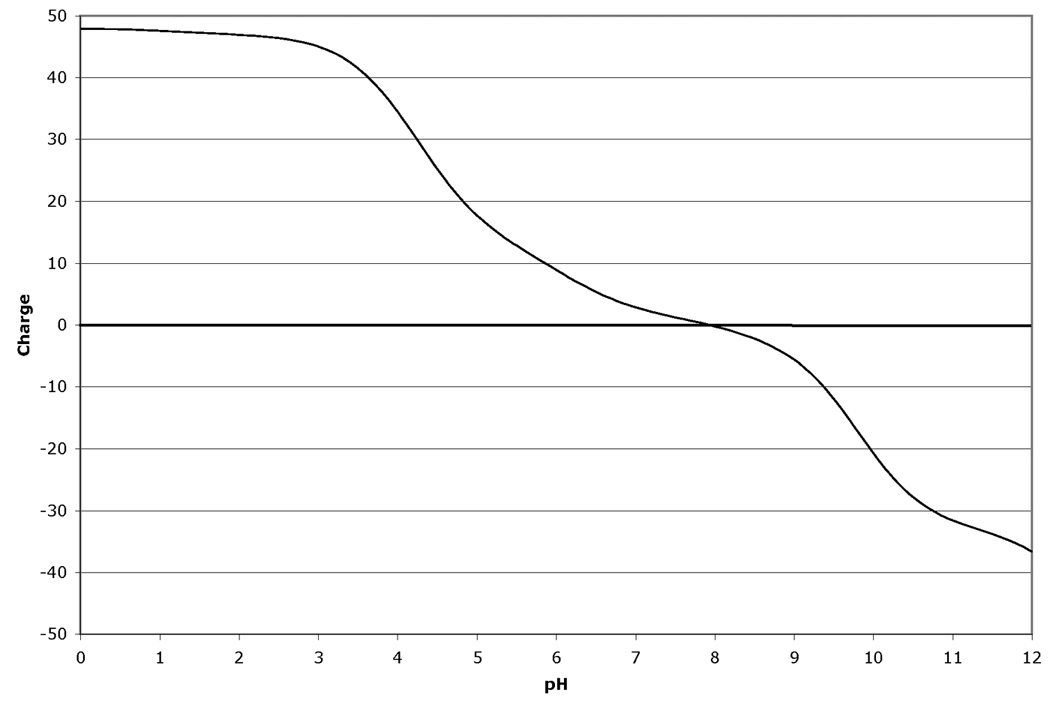
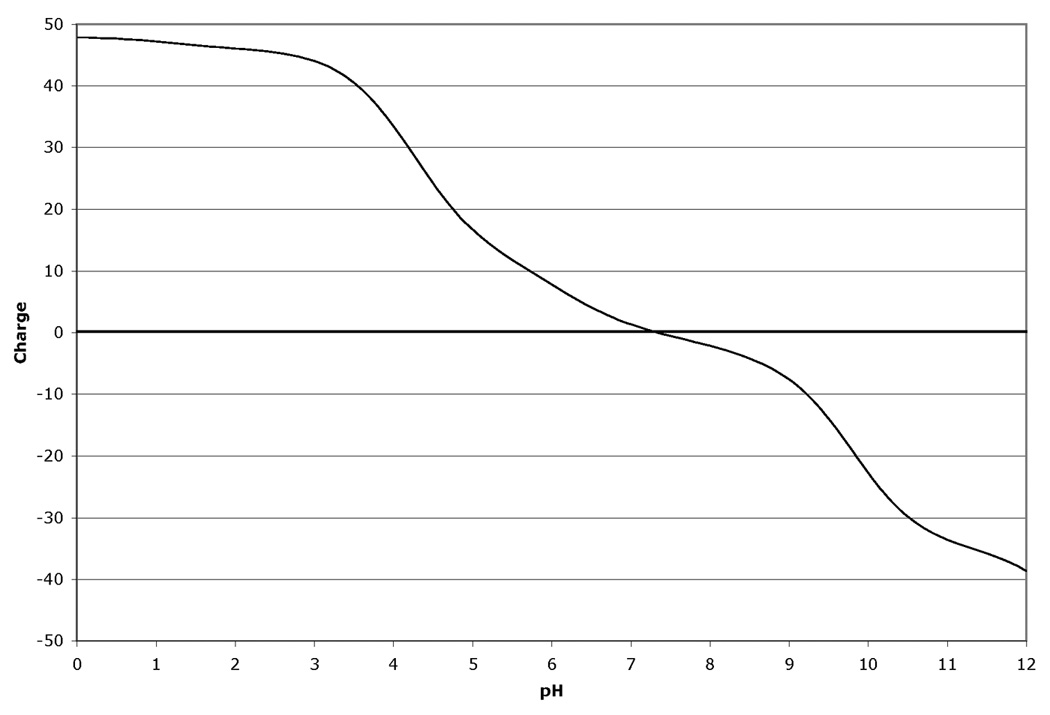
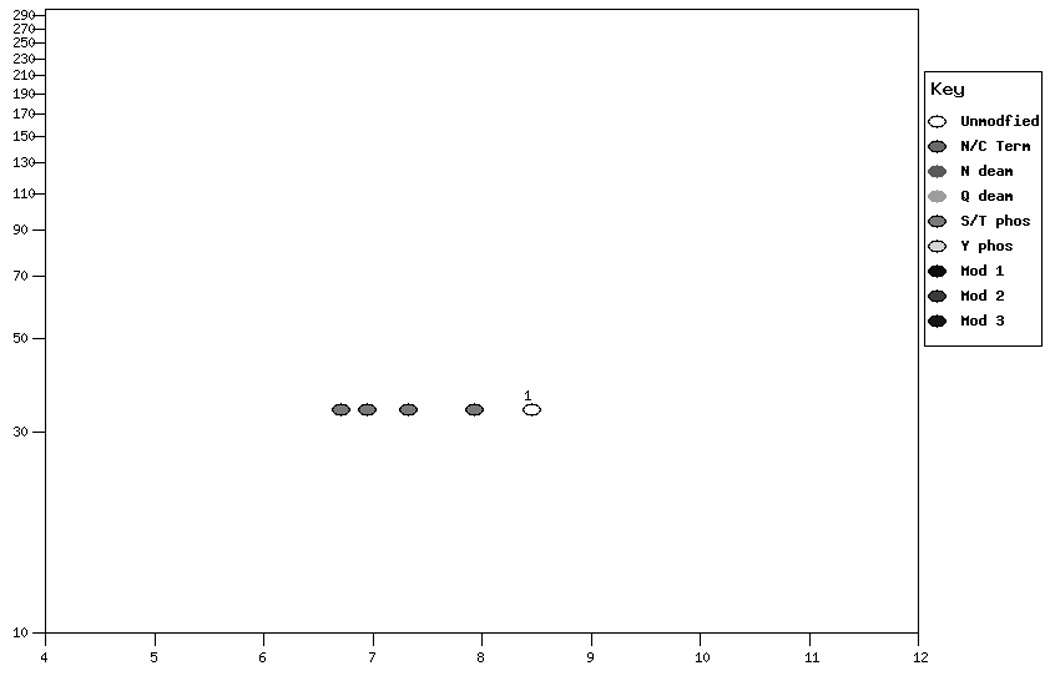
The fact that the migration in the isoelectric focusing dimension of proteins in 2D-GE is very sensitive to changes in pI makes 2D-GE a valuable technique for identifying modifications and mutations (1). Modifications such as phosphorylation that add highly charged groups to the protein can cause easily detectable changes in pI and therefore mobility of the protein in the isoelectric focusing dimension. Similarly, the changes in protein mass and pI due to mutations that cause a net loss or gain of charge on the protein by altering the number of charged acidic and basic residues present in the protein can also be calculated and displayed. The amount of mobility shift that is observed due to modification or mutation is dependent on three factors. First, the pKa value for the modification or change induced by mutation is very important to the final change in the protein pI. Modifications, such as phosphorylation, that introduce a group with either a strongly acidic or basic pKa will have a greater effect than those with a pKa value closer to neutrality. Similarly, a mutation that causes a change from an acidic residue to a basic residue will lead to a larger change in pKa than a change from a charged residue to a neutral residue. The larger pKa alteration will lead to a larger change in protein pI and therefore a larger mobility shift in the isoelectric focusing dimension of the 2D gel. Second, the number of modifications or residue changes will also have an impact on the mobility shift observed on the gels. Often for modifications, a train of spots will be observed. Interestingly, the shift in mobility is often not constant and the distance between spots can vary. This is explained by the third factor that determines the magnitude of the observed pI shift: the charge buffering capacity of the protein at a given pH. Since different proteins are comprised of different mixtures of positively and negatively charged amino acid depending on their primary amino acid sequence, the charge titration profile for each protein is unique. Thus the extent to which a modification changes the pI of the protein and impacts on the mobility of the protein, is different since the change titration profile changes with pH. Figure 1 shows an example of this for human cyclin-dependent kinase 2 (CDK2). Figure 1 Panel A shows the titration of the unmodified protein. Panels B–D show the titrations with 1, 2 or 3 phosphate groups. For comparison, Figure 1 Panel E shows the 2D gel spot positions calculated by ProMoST. Note that the magnitude of the shift in the calculated spot position due to additional phosphorylation varies from spot to spot. This variance correlates with the titration curves for CDK2 shown in Figure 1, Panels A–D.
Figure 1.
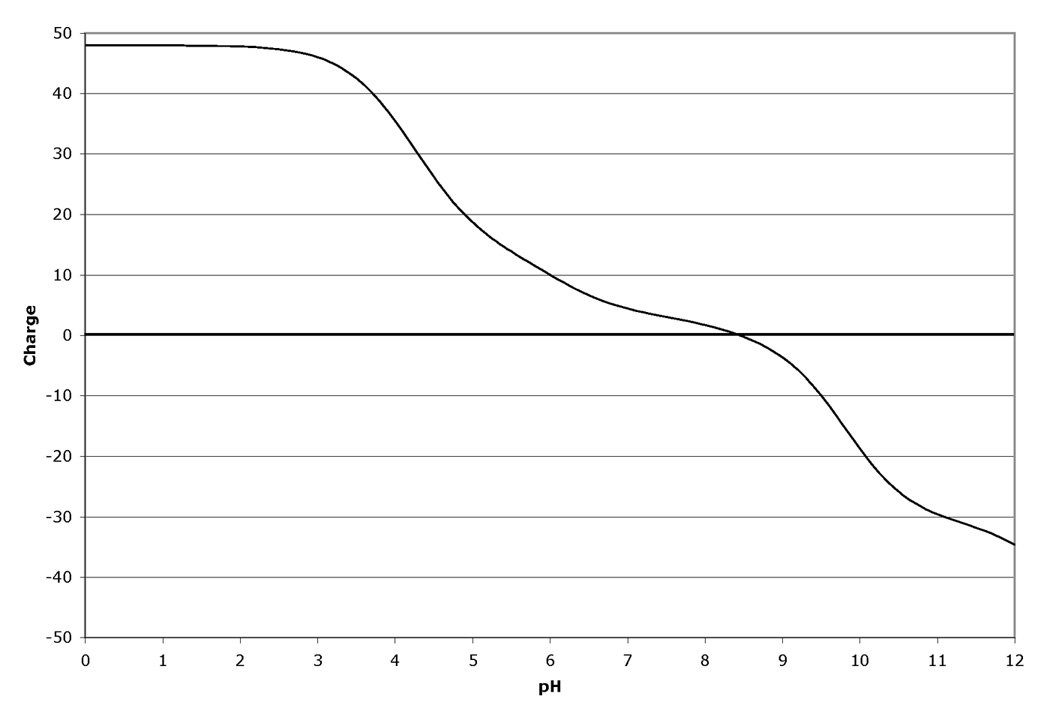
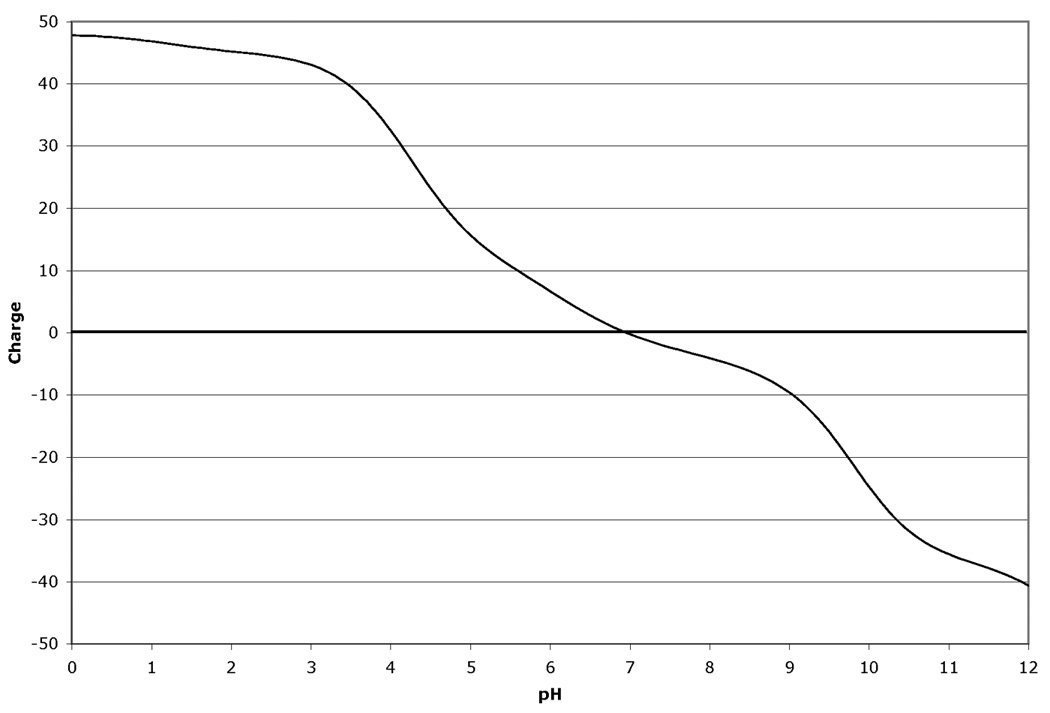
Panel A. Charge titration for unphosphorylated rat CDK2 (Cell division protein kinase 2 - Q63699).
Panel B. Charge titration for unphosphorylated rat CDK2 with one phosphotyrosine group.
Panel C. Charge titration for unphosphorylated rat CDK2 with two phosphotyrosine groups.
Panel D. Charge titration for unphosphorylated rat CDK2 with three phosphotyrosine groups.
Panel E. Pseudo-2D gel graphic showing the calculated position of CDK2 and phosphorylated forms of CDK2 (Q63699).
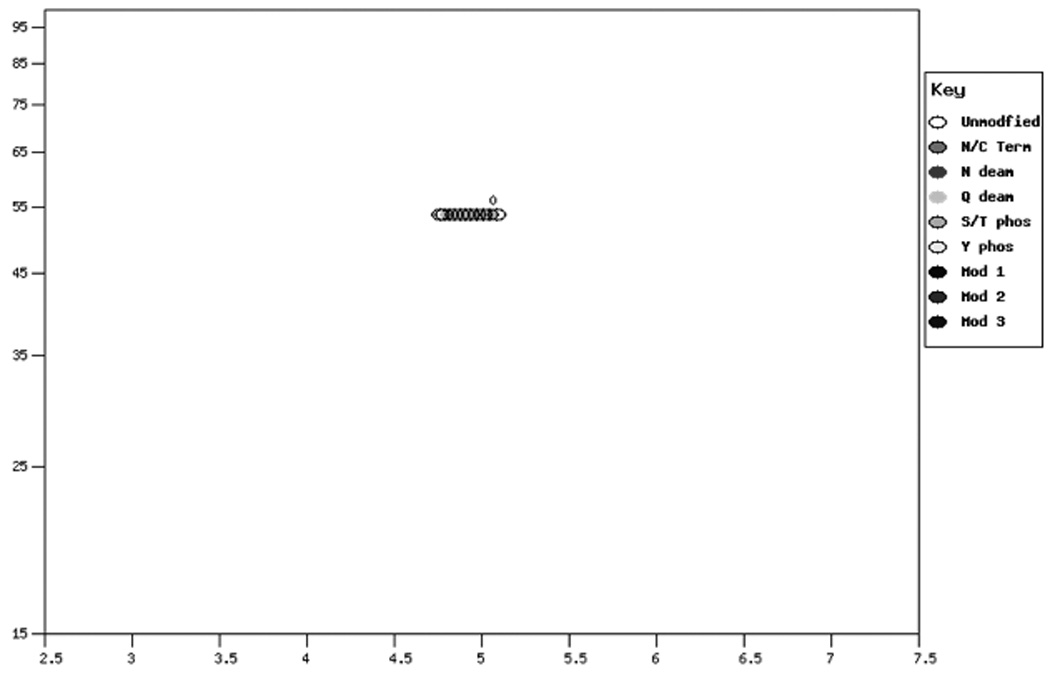
The correlation of the calculated mass and pI for a protein and an actual 2D gel is shown in Figure 2. Proteins were isolated from cultured rat fibroblast cells and analyzed by 2D-GE (Figure 2, Panel A). Proteins were extracted from gel spots, digested with trypsin and analysis by MALDI as previously described (7). Protein identification was carried out by peptide mass fingerprinting (PMF) using the Mascot program (8) Figure 2, Panel A shows the stained image of the 2D gel. Figure 2, Panel B shows the ProMoST produced graphic showing the calculated relative position of the unmodified and phosphorylated vimentin. Figure 2, Panel C shows the composite of stained image of the 2D gel with the calculated positions of unmodified and phosphorylated vimentin indicated. MALDI analysis of the spots confirmed their identification as containing vimentin.
Figure 2.
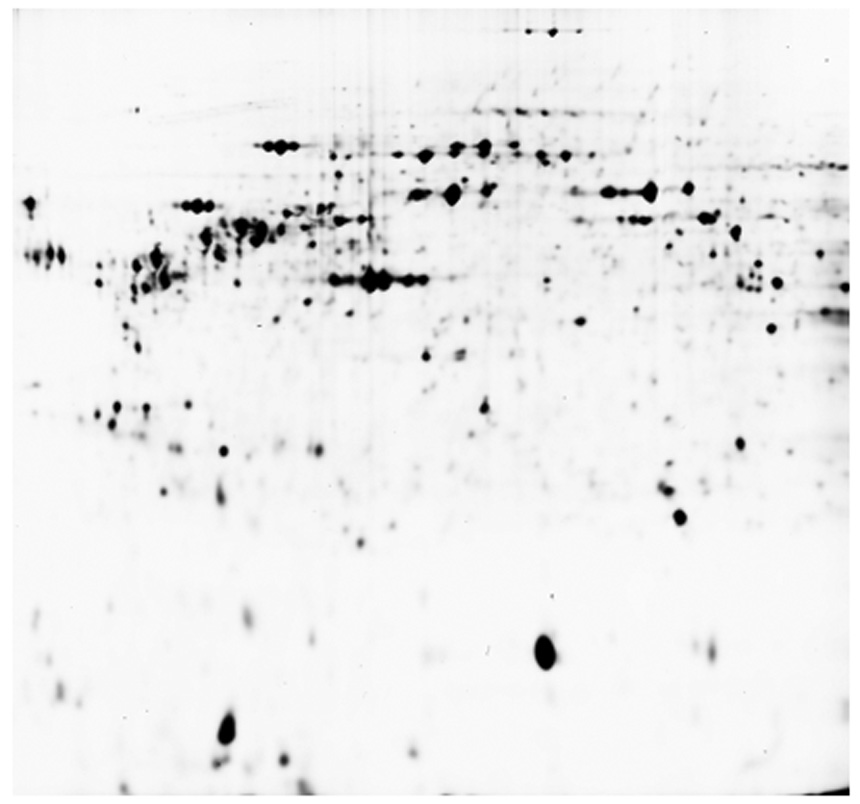
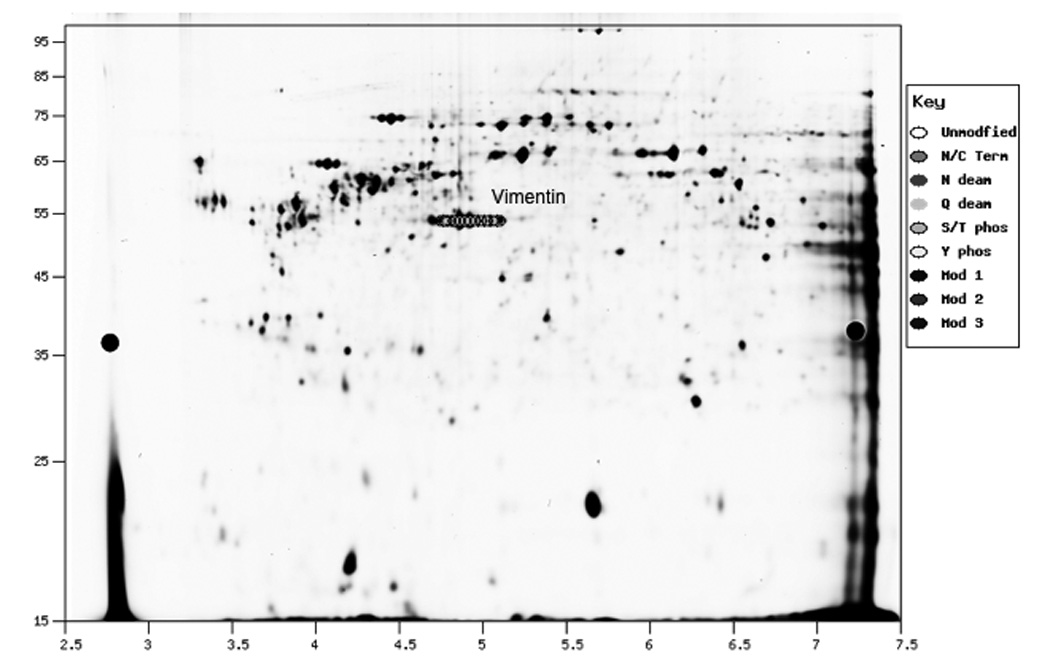
Panel A. 2D gel analysis of proteins from a whole cell extract cultured rat fibroblast. The gel is stained with Cy5 dye and visualized by florescence.
Panel B. Pseudo-2D gel graphic showing the calculated position of vimentin and phosphorylated forms of vimentin (P31000).
Panel C. Composite of actual and pseudo 2D gel.
1.3 Calculation of pI values
The charge state of the protein at a given pH is the sum of the negative and positive charges on the charged residues and the C-terminal and N-terminal residues of the protein. To determine the pI value for the protein, the pH value at which the charge state of the protein is equal to zero must be found. There are two basic approaches to calculating the pI value for a protein. One method is to construct a model of the charge state of protein as a series of differential equations and then solve the equations for the condition of zero net charge. While this method provides an exact determination of the pI value, it can be computationally expensive and an exact determination is not required for practical work.
A second approach is to determine the pH value at which the charge on the protein is neutral to within a small tolerance by successive approximations. In this method, a starting pH is chosen, usually pH 7, and the charge on the protein is calculated based on the pKa values for each of the charged residues and the N and C terminal amino acids of the protein. If the net charge on the protein at a pH of 7 is determined to be positive, the charge calculation is repeated with an increased pH value. If the net charge at a pH of 7 is determined to be negative, the charge calculation is repeated with a decreased pH value. After the first calculations, the pH is changed by 3.5 units, bringing the pH value to 3.5 or 10.5, and the calculation repeated. If the charge is same polarity as the pH 7.0 calculation, the pH is changed by an additional 3.5 units, bringing the pH to 0 or 14, and repeated. If the polarity of the charge switches, then the pH change is halved (1.75 units) and the calculation repeated. This iterative process of calculation, changing the pH value by half of the previous change, and recalculation is repeated until the net charge on the protein at the pH used for calculation is less than a preset tolerance value, usually ± 0.002, or the change in pH value is less than ± 0.01 pH units. This method can require at most 12 rounds of calculation, but typically converges in 6 or less rounds, making this method far faster than the exact method while yielding an answer of sufficient precision for practical work.
1.4 ProMoST algorithm
The ProMoST application is based on the successive approximation method for calculating protein pI values. The major difference is that in addition to the standard acidic amino acid residues (glutamic acid and aspartic acid), ProMoST also considers the pKa values of cysteine and tyrosine when calculating unmodified protein pI values. To calculate the pI values for modified proteins, the number and pKa values for the modifications is included in the calculation. For modifications such as phosphorylation in which there are multiple charge states, the pKa values for all charge states are also included in the calculation. In some cases, it is necessary to remove from the calculation the pKa values for the unmodified amino acid. For example, in the case of the phosphorylation of tyrosine, for each phosphate group added to the calculation, a tyrosine group is removed since the OH group on tyrosine is both the position of the charge and the site of phosphorylation.
The first step in the analysis is the determination of the amino acid composition of the protein. The molecular mass of the protein is calculated be summing the high precision mono or average isotopic masses of its amino acids and adding the mono or average isotopic mass of one water molecule, corresponding to an H at the N terminal end and a OH group at the C terminal end of the molecule.
The charge on the protein at a particular pH value is calculated using a method developed by Tabb (9). This approach works by determining the sum of the partial charges for all the charged amino acids and modifications using the standard equations:
- Positive ions:
- Negative ions:
The partial charge contribution, PCi, of any species to the entire protein is equal to:
where n is the number of that particular amino acid or modification. The total charge on the protein is the sum of the partial charges:
The pI is defined as the pH value at which all charges one the protein are balanced and the net charge is zero. To determine that pH value, an initial value of pH=7 is tested and the net charge on the protein calculated. Depending on the sign of the charge on the protein, Δ pH value of 3.5 is added or subtracted from the initial value of 7 and the charge on the protein recalculated. The process of dividing the Δ pH value in half and changing sign is reiterated until a net protein charge of less than 0.002 is obtained. This ‘binary search’ method rapidly converges on an accurate value for the protein pI.
2. Materials
The ProMoST web service provides an interface to a PERL based cgi program that calculates protein molecular mass and pI values. The interface allows the user to choose the standard pK values for charged amino acids and modifications or to alter the values. The program takes protein accession numbers, names or sequence as input and produces tables of values for modified and unmodified proteins. It also has a graphic output of a theoretical 2D gel.
2.1 Requirements to access ProMoST web application
ProMoST is a web base application. Currently it is freely available at either http://proteomics.mcw.edu or http://halligan.us/promost.html. It has been tested with most modern web browsers and is compatible with Microsoft Internet Explorer versions 6 and 7, Safari versions 2 and 3, Firefox version 2, SeaMonkey version 1.1 and Opera version 9 running on the Nintendo Wii console.
2.2 Requirements to host ProMoST web application
If confidentiality and control of protein sequences is required or especially heavy use is anticipated, an organization may wish to host a local copy of ProMoST. Upon request, ProMoST is distributed as a Perl cgi program and has been tested with the Apache web server. It depends on the CGI, Fcntl, and Spreadsheet∷WriteExcel CPAN perl modules as well as GD.pm and GD libraries for generating the graphic output.
3. Methods
The ProMoST interface has been designed to allow for rapid use by occasional users while still meeting the demands of more advanced users. To do this, two versions of the interface to the program have been designed. The default interface is the basic interface that allows the user to submit either protein sequence data or accession numbers and use predefined modifications to generate tables and gel graphics. The advanced interface additionally allows the user to define additional modifications and alter the standard pKa values used in the calculation.
3.1 Basic interface
Figure 3, Panel A shows the default or ‘simple’ interface to ProMoST. A web interface is used to get protein information from the user. The user has a choice of either entering the protein information in a text box or uploading a file. The protein information can consist of a list of accession numbers or protein names, or protein sequences in FASTA format (10). The program dynamically determines the format of the input protein data. The accession numbers or protein names are used by the program to obtain the sequence data from a local copy of the NCBI nr protein database.
Figure 3.
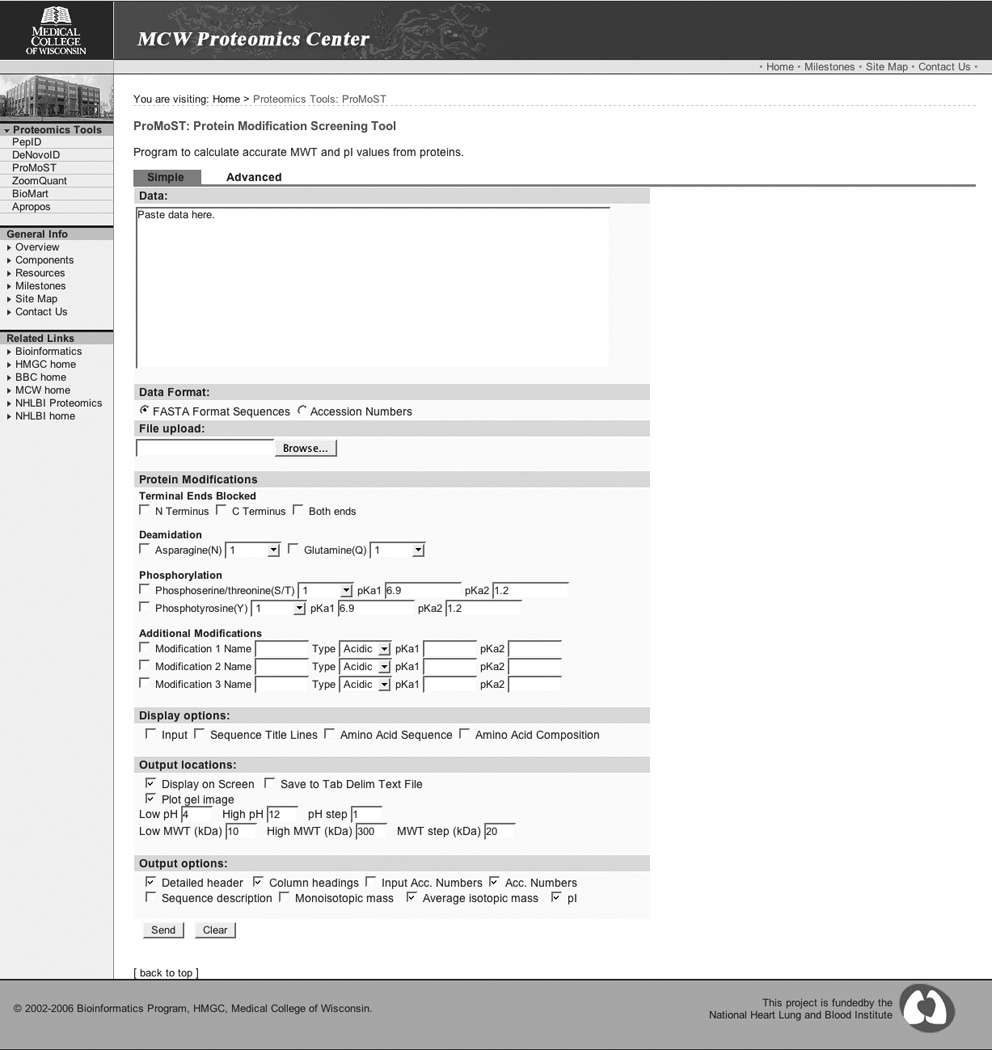
Panel A. ProMoST Standard Interface.
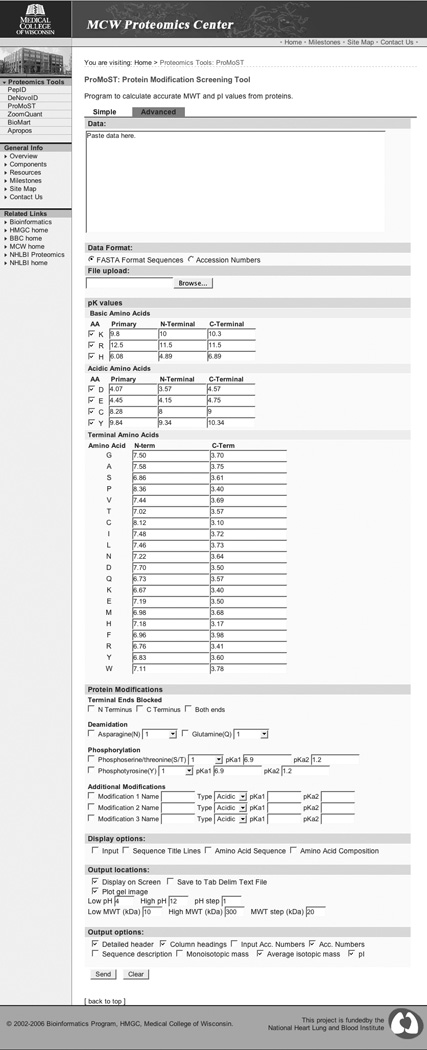
Panel B. ProMoST Advanced Interface.
In addition to the normal charged amino acids, values for the common protein modifications (deamidation and phosphorylation) are also included. The user is able to specify the number of each modification that is to be considered. Thus, it is possible to examine the effects of a single phosphotyrosine or a series of up to 10 phosphotyrosines on the same protein molecule. The user can also choose to block either the N terminal, C terminal, or both ends of the protein.
3.2 Advanced interface
In addition to the standard interface for ProMoST, there is also an ‘advanced’ interface that allows for more values to be customized (Figure 3, Panel B). The standard pK values for the charged amino acids (internal, C-terminal and N-terminal) are presented by the web interface as a series of text boxes. The user can thereby examine and change any of the default pK values and also has the ability to exclude any of the charged amino acids from the pI calculation, as would be required if the residue were modified to an uncharged state.
3.3 Defining new PTMs
To extend the ability of ProMoST to calculate the pI of modified proteins, the web interfaces allows the user can to add the name and pK values for up to three additional user defined protein modifications. For each of the modifications, the user specifies a label to be used in the text output of the program. The user also indicates if the modification will produce a negative or positive charge and up to two pKa values.
3.4 Input Options
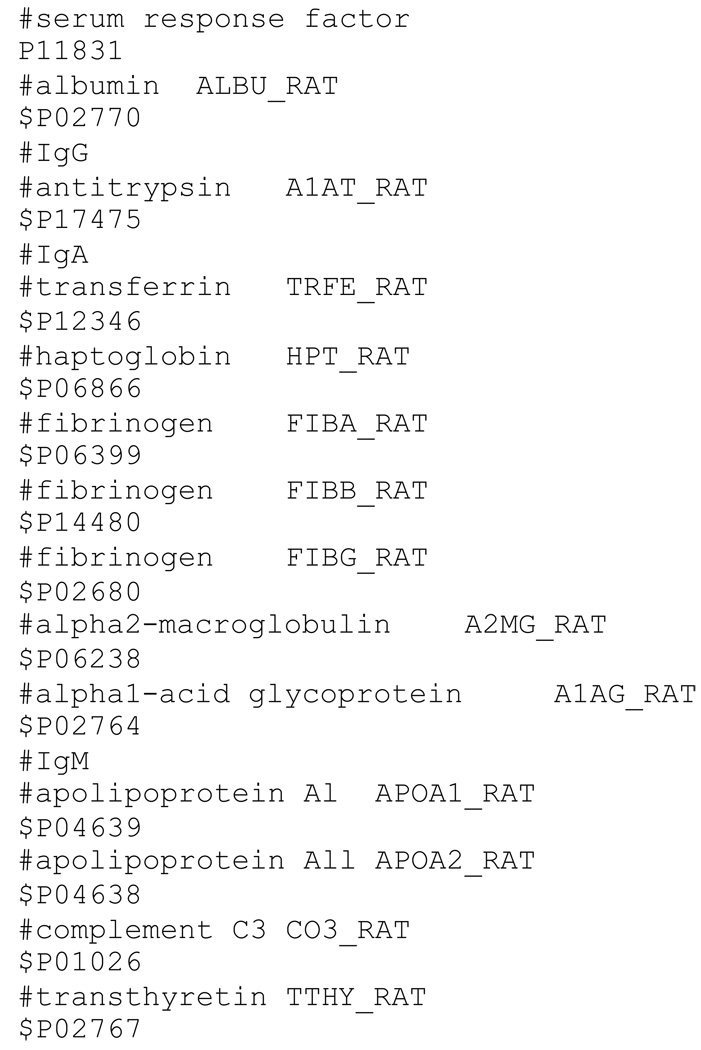
The standard interface allows for the input of either sequence information in FASTA format or as accession numbers. This data can either be submitted in a text box on the web form or uploaded as a file. In addition to these standard input options, there are several extended options. Lines that are prefaced with a number sign (#) are treated as comments and ignored by ProMoST. This allows text files containing either FASTA sequences or accession numbers to be annotated. FASTA sequence header lines or accession numbers prefaced with a dollar sign ($) indicate sequences for which post translational modifications should not be calculated or displayed. This is useful if the user wishes to examine the mobility of a protein in the context of other high abundance proteins that are normally present in the sample. An example of this is shown in Figure 4 and Figure 5. Figure 4 shows an input text file and Figure 5 shows the resulting ProMoST output. The goal of this demonstration is to show the phosphorylation of the alpha 1-acid glycoprotein, an acute phase serum protein, in the context of other serum proteins.
Figure 4.
Input text file for ProMoST analysis. Lines beginning with # are considered as comments and are ignored by ProMoST. The $ preceding the accession numbers for major serum proteins indicates that modified forms of these proteins should not be calculated or displayed.
Figure 5.
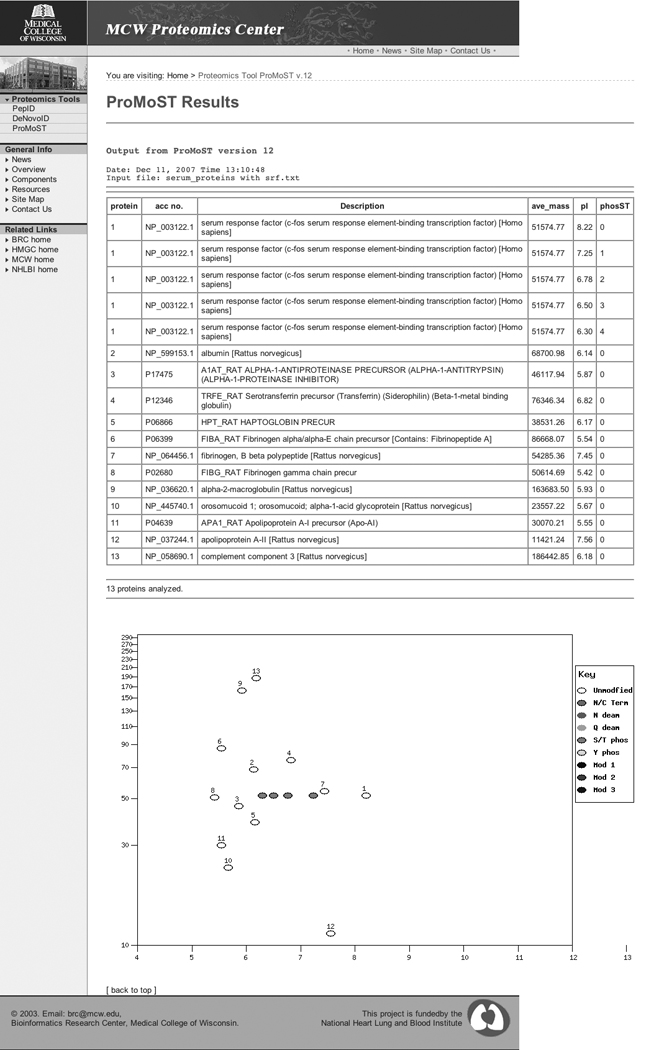
Output of ProMoST using the text file from Figure 4 as input.
3.5 Output options
The output of the program is divided into two sections: the input data and the calculated results. The user can opt to have the input data displayed in the form of the actual input accession number/protein name, the deduced accession number, the sequence read from the database, or the composition of the protein. Any or all of these options can be active at the same time.
There are three main output modes, all of which can be used at the same time. Data can be displayed to the screen, or it can be either saved or displayed or saved as a text file or Excel format file. The screen display takes the form of a HTML table. The user has the option to choose from different columns of data. The molecular mass choices include the monoisotopic mass, the average isotopic mass, both or neither calculated molecular mass. The protein information can be displayed as the input accession numbers, the deduced accession numbers, or sequence description. The calculated pI is optional. The table also shows which modifications are active for each line in the table. An example of the output of ProMoST is shown in Figure 5.
Data can also be sent to either a tab delimited text file or to an Excel format file. The files can be either viewed on the screen with the browser (text files) or with Excel (Excel files). By using the browser “Save link as” option, the use can directly save the text or Excel file to their computer.
A graphic gel image output is also available. The user can specify the molecular mass and pI range of the gel as well as the gel size. Proteins are plotted to the gel as ovals at the location of their calculated molecular mass and pI. The ovals are color coded for the modification. The parent, unmodified protein is plotted as an open oval and in the case of multiple proteins on the same plot, is labeled with a protein index number that matches the table or file of values.
4. Notes
1 Other uses of ProMoST
Although ProMoST was primarily designed to calculate the mass and pI values for post-translational modifications and map them to ‘theoretical’ 2D gels, it can also be used to predict the mass, pI and mobility of mutant and variant forms of proteins. Using the ‘FASTA sequence’ option, both the original and variant sequences can be entered and analyzed. This allows for the comparison of mutant, variant or processed forms of a protein.
ProMoST can also be used to display the results from LC-MS/MS experiments in a graphic form. The Visualize program, also developed by the Medical College of Wisconsin NHBL Proteomics Center, allows for the analysis of results of LC-MS/MS experiments. As one of its output options, it can create files of accession numbers that can be directly imported into ProMoST and the proteins identified by LC-MS/MS can be visualized as a pseudo-2D gel.
2 Troubleshooting and limitations
One of the most common errors encountered by ProMoST users is the failure of ProMoST to recognize their input sequence data. The usually cause of this problem is that the sequence information is improperly formatted. ProMoST requires that sequences be submitted in FASTA format. The key component to FASTA sequence format is that each sequence must begin with a header line, which is designated by a greater than symbol (>) at the beginning of the line. If a properly constructed header line is not present, then ProMoST fails to recognize the sequence.
It is important to remember that the pI values calculated by ProMoST are theoretical and approximate. While these values are useful for approximating the migration of proteins on 2D gels, they are not meant to be accurate for non-denatured proteins. In native proteins, it is possible that some of the potentially charged residues are not solvent accessible and therefore may not contribute to protein’s overall charge. Furthermore, microenvironments within the protein may allow amino acids to interact and influence the pKa of individual amino acid residues.
Acknowledgments
The 2D gel image of rat fibroblast proteins was graciously provided by I. Matus. This work was supported in part by the NHLBI Proteomics Center contract NIH-N01 HV-28182.
References
- 1.Gorg A, Weiss W, Dunn MJ. Current two-dimensional electrophoresis technology for proteomics. Proteomics. 2004;4:3665–3685. doi: 10.1002/pmic.200401031. [DOI] [PubMed] [Google Scholar]
- 2.Robinson NE, Robinson AB. Deamidation of human proteins. Proc Natl Acad Sci U S A. 2001;98:12409–12413. doi: 10.1073/pnas.221463198. [DOI] [PMC free article] [PubMed] [Google Scholar]
- 3.Halligan BD, Ruotti V, Jin W, Laffoon S, Twigger SN, Dratz EA. ProMoST (Protein Modification Screening Tool): a web-based tool for mapping protein modifications on two-dimensional gels. Nucleic Acids Res. 2004;32:W638–W644. doi: 10.1093/nar/gkh356. [DOI] [PMC free article] [PubMed] [Google Scholar]
- 4.Cantor CR, Schimmel PR. Biophysical chemistry. San Francisco: W. H. Freeman; 1980. [Google Scholar]
- 5.Fevold HL. In: "Amino acids and proteins; theory, methods, application". Greenberg DM, editor. Springfield, Ill: Thomas; 1951. p. ix, 950. [Google Scholar]
- 6.Dunn MJ. Two-dimensional gel electrophoresis of proteins. J Chromatogr. 1987;418:145–185. doi: 10.1016/0378-4347(87)80008-7. [DOI] [PubMed] [Google Scholar]
- 7.Freed JK, Smith JR, Li P, Greene AS. Isolation of signal transduction complexes using biotin and crosslinking methodologies. Proteomics. 2007;7:2371–2374. doi: 10.1002/pmic.200700219. [DOI] [PubMed] [Google Scholar]
- 8.Perkins DN, Pappin DJ, Creasy DM, Cottrell JS. Probability-based protein identification by searching sequence databases using mass spectrometry data. Electrophoresis. 1999;20:3551–3567. doi: 10.1002/(SICI)1522-2683(19991201)20:18<3551::AID-ELPS3551>3.0.CO;2-2. [DOI] [PubMed] [Google Scholar]
- 9.Tabb DL. 2001 [Google Scholar]
- 10.Lipman DJ, Pearson WR. Rapid and sensitive protein similarity searches. Science. 1985;227:1435–1441. doi: 10.1126/science.2983426. [DOI] [PubMed] [Google Scholar]


