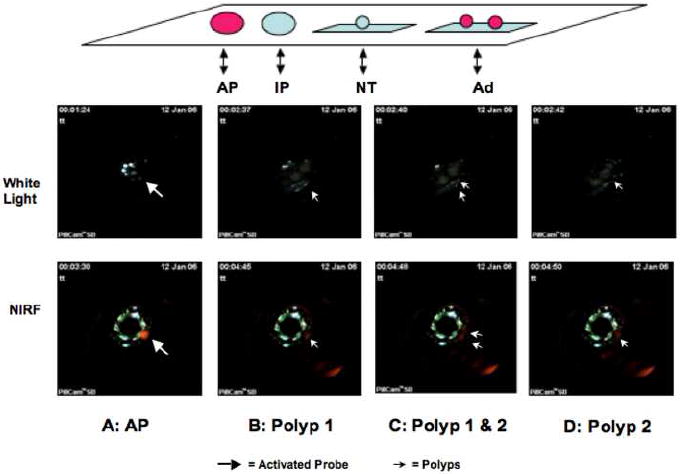
Figure 5.

Top Panel: Sample layout during typical white light and NIRF imaging with CE (top panel). Schematic illustration of sample layout in the order from left to right: AP = activated Prosense™ 680 as positive control; IP = negative inactive Prosense™ 680 as negative control; 3) NT= negative tissue control from uninjected animals; Ad = adenomatous polyps dissected from ApcMin/+ mouse colon. Middle and Bottom Panels: CE based white light and NIRF images of activated probe (AP) and two adenomatous polyps (Ad). The four panels show first the visualization of the activated probe (AP, block arrow) followed by images of two adenomatous polyps as they move into the view of the CE with polyp 1 visualized first (single solid arrow), both polyps 1 & 2 (double solid arrow) and then only polyp 2 (single solid arrow). The time when the AP probe is first visible serves as a reference for other frames which show images of the polyps under white light or NIRF. Note that the time elapsed between visualization of AP and visualization of polyps is almost identical with white light and NIRF imaging.
