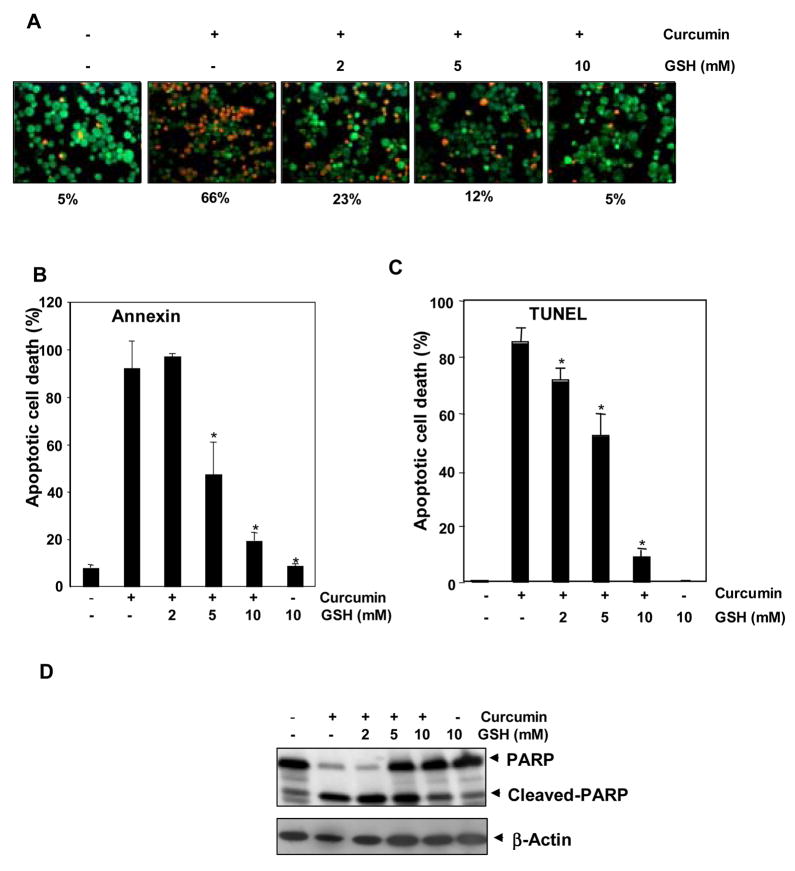
FIGURE 4. Effect of GSH on curcumin-induced cell death.
Glutathione inhibited curcumin-induced cell death in a concentration-dependent manner. A, KBM-5 cells were pretreated with indicated concentrations of GSH for 2 h and then treated with 50 μM concentration of curcumin for 16 h. Cells were stained with Live and Dead assay reagent for 30 min and then analyzed under a fluorescence microscope. Red color highlights dead cells, and green color highlights live cells. B, Flow cytometric analysis of annexin V-FITC staining to detect early apoptotic effects. KBM-5 cells were pretreated with indicated concentrations of GSH for 2 h and then treated with 50 μM concentration of curcumin for 24 h. Cells were incubated with anti-annexin V antibody conjugated with FITC and then analyzed with a flow cytometer for early apoptotic effects. Each bar represents mean ± S.D. from three replicates and two independent experiments were carried out. *p < 0.01, as compared to curcumin treated group. C, Flow cytometric analysis of TUNEL staining to detect apoptotic effects. KBM-5 cells were pretreated with indicated concentrations of GSH for 2 h and then treated with 50 μM concentration of curcumin for 24 h. Cells were fixed, stained with TUNEL reagent. Each bar represents mean ± S.D. from three replicates and two independent experiments were carried out. *p < 0.01, as compared to curcumin treated group. D, Western blot analysis of PARP cleavage. KBM-5 cells were pretreated with indicated concentrations of GSH for 2 h and then treated with 50 μM concentration of curcumin for 24 h. Whole-cell extracts were prepared and subjected to Western blot analysis using anti-PARP antibody.

