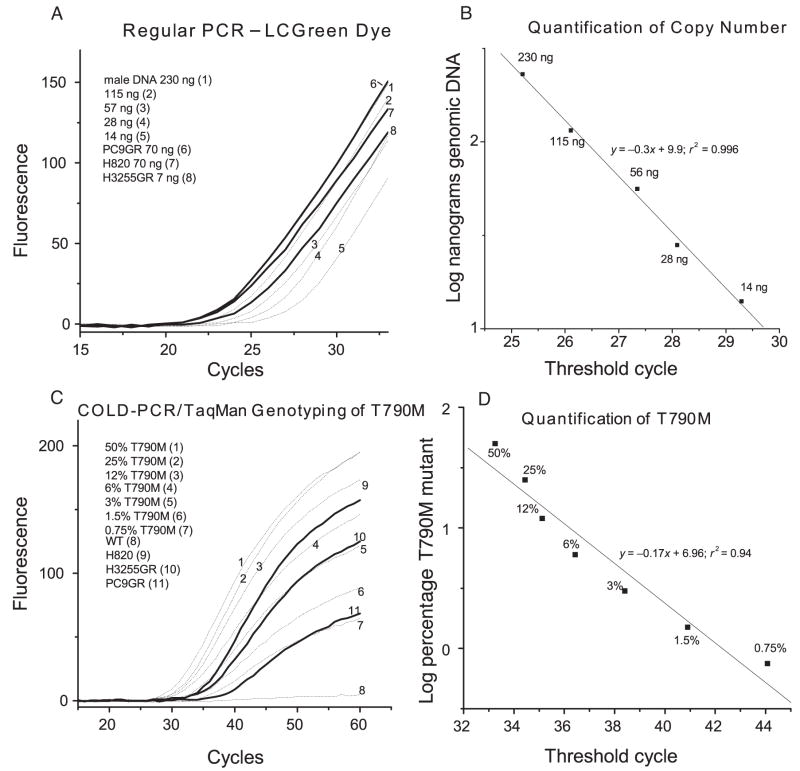
Fig. 3. Quantification of the T790M mutation in NSCLC cell lines.
(A), Primary amplification curve for EGFR exon 20 with the LCGreen dye. DNA from NSCLC cell lines (PC9GR, H820, and H3255GR) was serially diluted into human male DNA and amplified. (B), Plot of the log concentration of input genomic DNA vs threshold cycle to quantify the copy number of EGFR xon 20. (C), Primary amplification curve for the T790M mutation from EGFR exon 20 with COLD-PCR/Taqman genotyping (MGB probe). Serial dilutions of T790M mutant DNA and DNA from NSCLC cell lines were tested. (D), Plot of the log concentration (percent) of T790M mutant DNA vs threshold cycle to quantify the percentage of T790M in NSCLC cell lines. WT, wild type.

