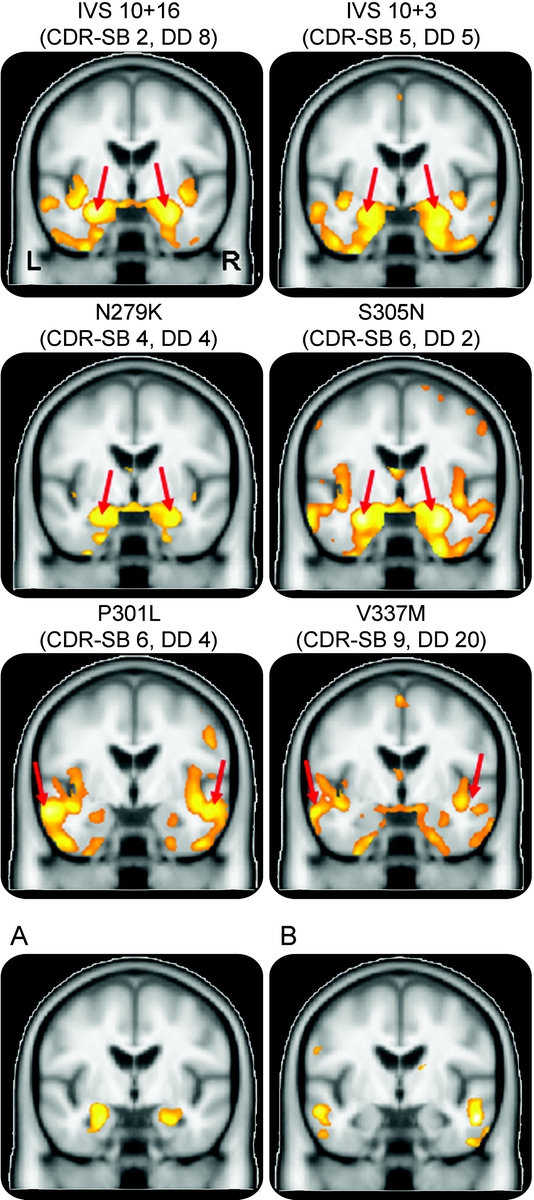
Figure 2 Patterns of temporal lobe gray matter loss in subjects with IVS10+16, IVS10+3, N279K, S305N, P301L, and V337M mutations
Coronal slices through the temporal lobes showing gray matter loss in each group compared with controls. The IVS10+16, IVS10+3, N279K, and S305N groups show the most significant loss in the medial temporal lobes (red arrows), whereas the P301L and V337M groups show the most significant loss in the lateral temporal lobes (red arrows). Bottom coronal slices show results of direct comparisons between the “medial temporal” subjects (IVS10+16, IVS10+3, N279K, and S305N) and the “lateral temporal” subjects (P301L and V337M). (A) Regions that show greater loss in the “medial temporal” group than the “lateral temporal” group; (B) regions that show greater loss in the “lateral temporal” group than the “medial temporal” group. CDR-SB = median Clinical Dementia Rating Scale sum of boxes; DD = median disease duration (time from onset to scan).
