
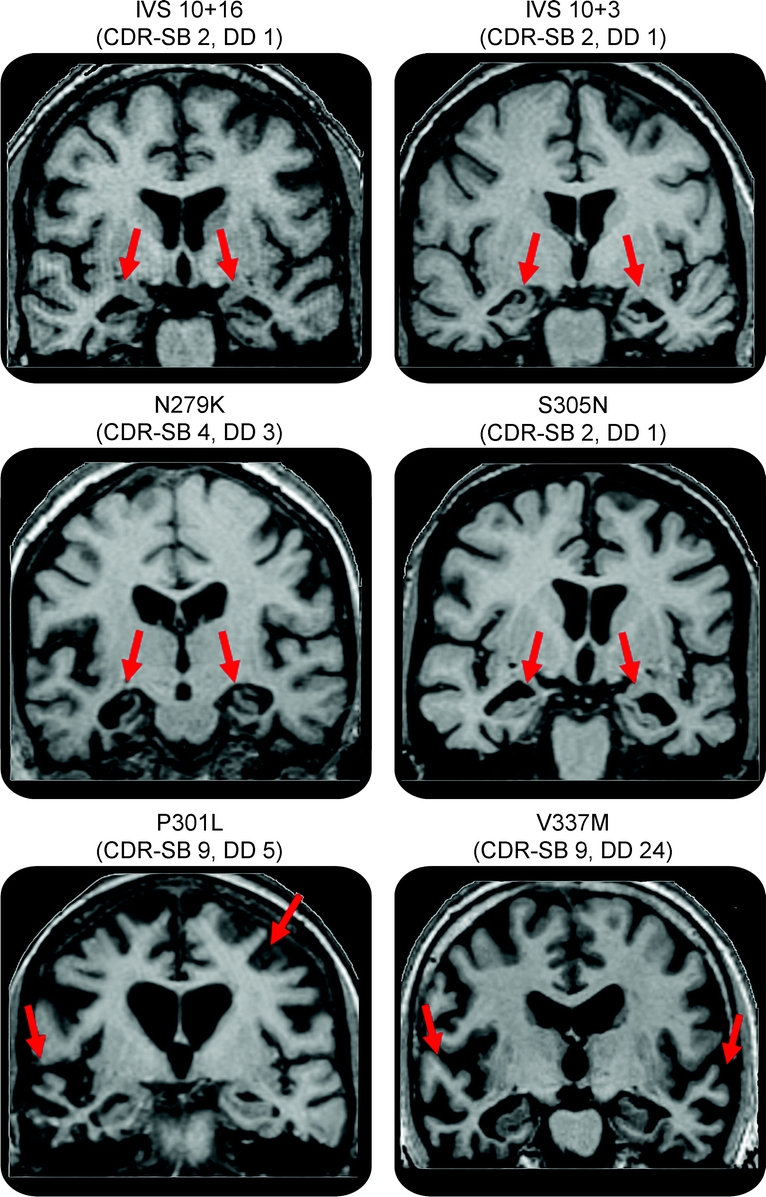
Figure 3 MRI scans from 6 subjects each with a different MAPT mutation
The IVS10+16, IVS10+3, N279K, and S305N subjects show atrophy in the medial temporal lobes with relative sparing of the lateral temporal lobes. The P301L and V337M subjects show severe atrophy of the lateral temporal lobes with relative sparing of the medial temporal lobe. CDR-SB = Clinical Dementia Rating Scale sum of boxes for each subject; DD = disease duration for each subject (time from onset to scan).