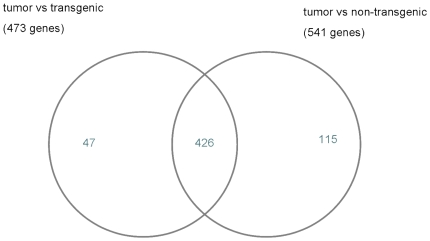
Figure 2. Venn diagram for significantly regulated genes.
Venn diagram for significantly differential expressed genes. Comparison of tumor and transgenic unaltered lung tissue with non-transgenic samples. 426 genes were found in tumor, respectively, which were at least 2-fold differentially expressed (FDR = 0.001).

