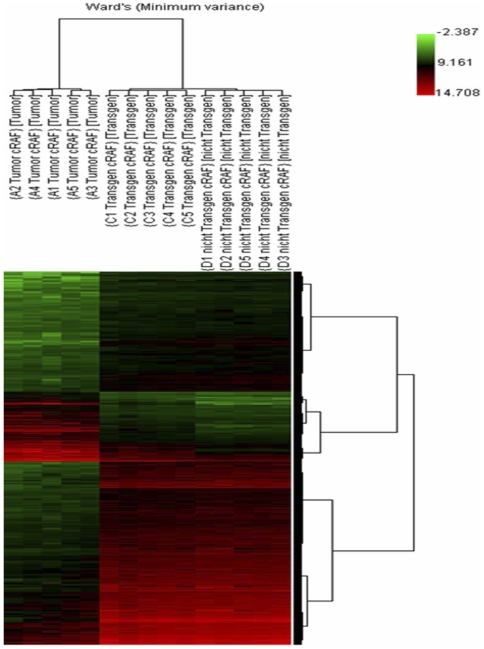
Figure 4. Result of the hierarchical cluster analysis.
The normalized data were used for the Ward's Minimum Variance linkage clustering algorithm. A total of 3246 differentially expressed genes (mean channel intensity >100, FDR: 0.1, Bad Flags: 5) were used in the cluster dendogram to obtain a clear segregation of the analyzed groups (tumor, transgenic and non-transgenic). Expression values were colour coded with a red green scale. Green, transcript levels below the median; black, equal to the median and red, greater than median.

