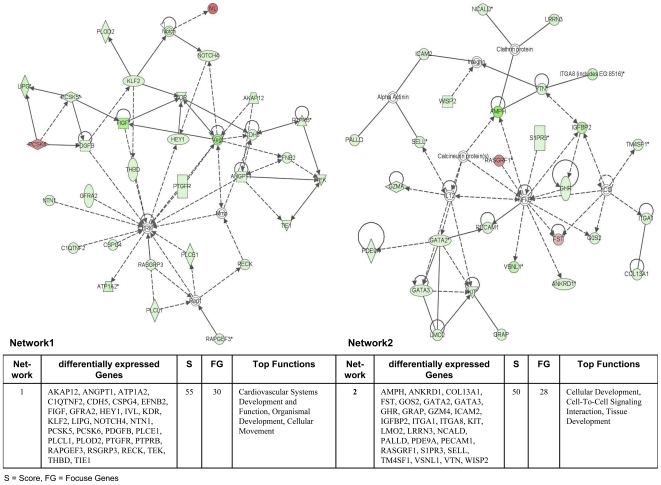
Figure 5. Ingenuity networks: adenocarcinoma versus transgenic mice.
Ingenuity networks generated by mapping the focus genes that were differentially expressed between tumor and transgenic unaltered lung tissue (part I). Each network is graphically displayed with genes/gene products as nodes (different shapes represent the functional classes of the gene products) and the biological relationships between the nodes as edges (lines). The length of an edge reflects the evidence in the literature supporting that node-to-node relationship. The intensity of the node color indicates the degree of up- (red) or downregulation (green) of the respective gene. A solid line without arrow indicates protein-protein interaction. Arrows indicate the direction of action (either with or without binding) of one gene to another. IPA networks were generated as follows: Upon uploading of genes and corresponding fold-change expression values (done separately for tumor vs transgenic and tumor vs non-transgenic differentially expressed genes), each gene identifier was mapped to its corresponding gene object in the IPA Knowledge Base (part of the IPA algorithm). Fold-change expression values were used to signed genes whose expression was differentially regulated; these “focus genes” were overlaid onto a global molecular network contained in the IPA Knowledge Base. Networks of these focus genes were then algorithmically generated based on their connectivity and scored according to the number of focus genes within the network as well as according to the strength of their associations.

