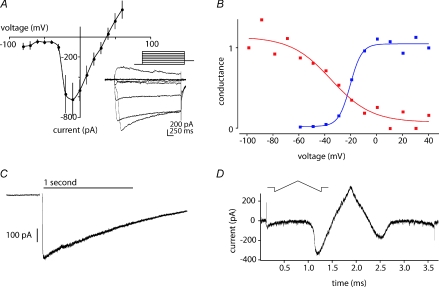
Figure 4. Activation and inactivation properties.
A, current–voltage relation of the TTX-insensitive current derived from step depolarizations from −80 to +60 mV (n= 8). The inset shows an example of current traces from a family of depolarizing voltage steps. The mean inward current between 50 to 120 ms after step onset served to construct the I–V curve. B, activation and inactivation curves for the TTX-I Na+ current. The activation curve (red) is a conductance transform of the I–V curve in A. The inactivation curve (blue) was obtained from a voltage protocol composed of prepulse of 3.5 s duration at the test holding potentials between −100 to +40 mV, followed by an activating step to 0 mV. The inward currents were normalized to the conductance obtained with a −100 mV prepulse, and plotted as a function of the prepulse holding potential. C, current inactivation is slow. The TTX-insensitive inward current activated by a maintained deploarization to −20 mV decays slowly with time, to 41% of its peak value after 1 s. Curve fitting to a single exponential function yielded τ= 1.41 ± 0.005 s. D, double ramp command from −140 mV to +70 mV and back to −140 mV. The holding potential between trials was −60 mV. The peak inward current on the ascending phase was mirrored by a smaller, sustained peak on the descending phase.

