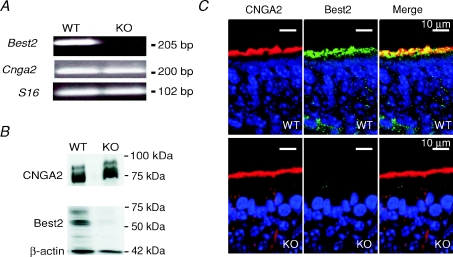
Figure 1. Comparison of Best2 mRNA expression and Best2 immunoreactivity in the mouse olfactory epithelium of WT and KO mice.
A, reverse transcription–polymerase chain reaction (RT-PCR) derived cDNA products amplified from RNA of the olfactory epithelium in WT and KO mice using specific primers for Best2, CNGA2 and S16, as indicated in the figure. The predicted size of the products for Best2, CNGA2 and S16 was respectively 205, 200 and 102 base pairs (bp). B, Western blot analysis of proteins of the olfactory epithelium in WT and KO mice probed with antibodies against Best2, CNGA2 and β-actin. Bands of the appropriate molecular mass were observed for each protein in WT mice, whereas only bands corresponding to CNGA2 and β-actin were detected in KO mice. The expected molecular mass for Best2, CNGA2 and β-actin was respectively 57, 75 and 42 kDa. C, immunostaining of sections of the olfactory epithelium. Confocal micrographs showing Best2 and CNGA2 expression in the ciliary layer of the olfactory epithelium of WT and KO mice. CNGA2 and Best2 co-expression was evident in WT mice, whereas no immunoreactivity to Best2 was detectable in KO mice. Each image on the right was obtained from the merge of the respective left and centre images. Cell nuclei were stained by DAPI.

