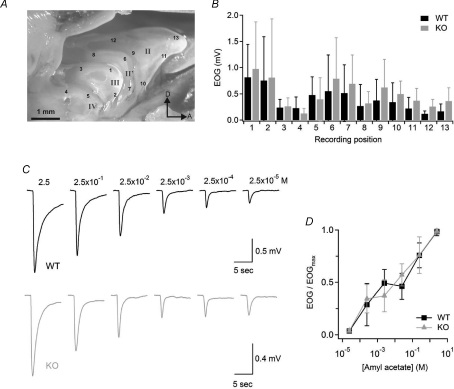
Figure 2. Odorant sensitivity in WT and KO mice.
A, photomicrograph of the olfactory turbinate system. Roman numbers designate individual turbinates. Arabic numbers indicate the locations where EOG responses were recorded. D, dorsal; A, anterior. B, average EOG amplitudes in response to a 100 ms pulse of odorant vapour from a bottle containing 2.5 m amyl acetate liquid solution measured at the locations indicated in A (n= 7–14). C, representative EOG recordings from WT (black traces) or KO (grey traces) mice in response to 100 ms pulses of amyl acetate vapours. Numbers above traces are the concentrations of amyl acetate solutions in the bottle. EOG recordings were from location 1. D, EOG amplitudes were normalized to the value measured in response to the vapour of a 2.5 m amyl acetate solution, averaged, and plotted versus amyl acetate concentrations in solution for WT (n= 14; black symbols) or KO (n= 13, grey symbols) mice. Data points are linked with straight lines.

