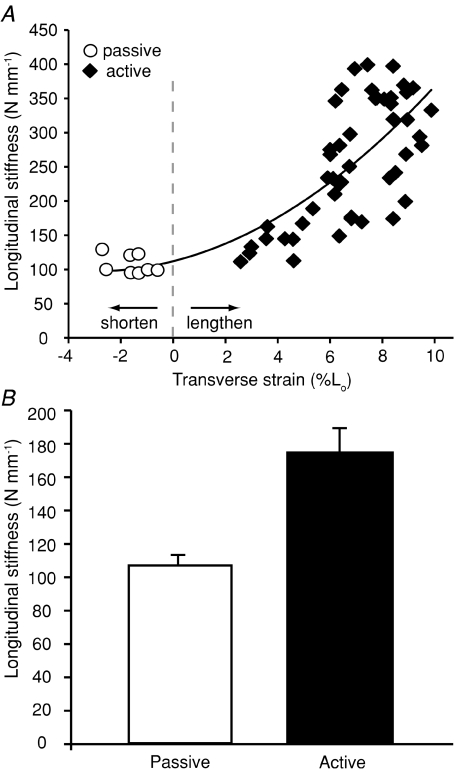
Figure 5. A comparison of measured longitudinal stiffness during passive and active force production.
A, data pooled for four individuals show longitudinal stiffness increases curvilinearly with increasing stretch of the aponeurosis in the transverse direction. Each data point represents a single contraction. The data are fitted with a second order polynomial (R2= 0.62). This pattern suggests that the biaxial loading of the aponeurosis during active contractions increases longitudinal stiffness. B, a comparison of average longitudinal stiffness during passive and active force production. The comparison shown is limited to active contractions occurring at forces comparable to passive tests (<50 N) in order to limit the confounding effect of large force variation. Stiffness differs significantly between passive and active conditions (P= 0.004). Error bars are the standard error of the mean.

