
Figure 3.
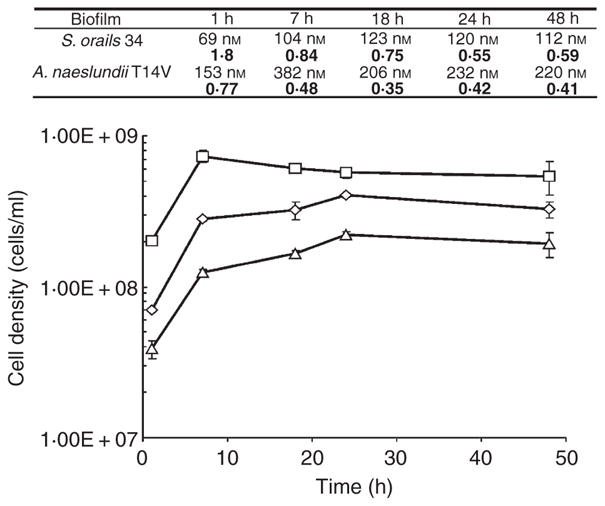
Changes in cell numbers of single-species biofilms of Streptococcus oralis 34 (triangles), S. oralis 34 luxS mutant (diamonds) and Actinomyces naeslundii T14V (squares). Associated table shows autoinducer-2 (AI-2) concentrations from the effluent of single-species biofilms of S. oralis 34 and A. naeslundii T14V at each time point. The upper value is the calculated (determined using the data shown in Fig. 1b) concentration of AI-2 produced by the biofilm and the lower (bold) value is the concentration ratio (nanomoles of AI-2 l−1 divided by cell numbers ml−1). AI-2 concentration within the effluent from S. oralis 34 luxS mutant biofilms was below the threshold for detection and quantification.