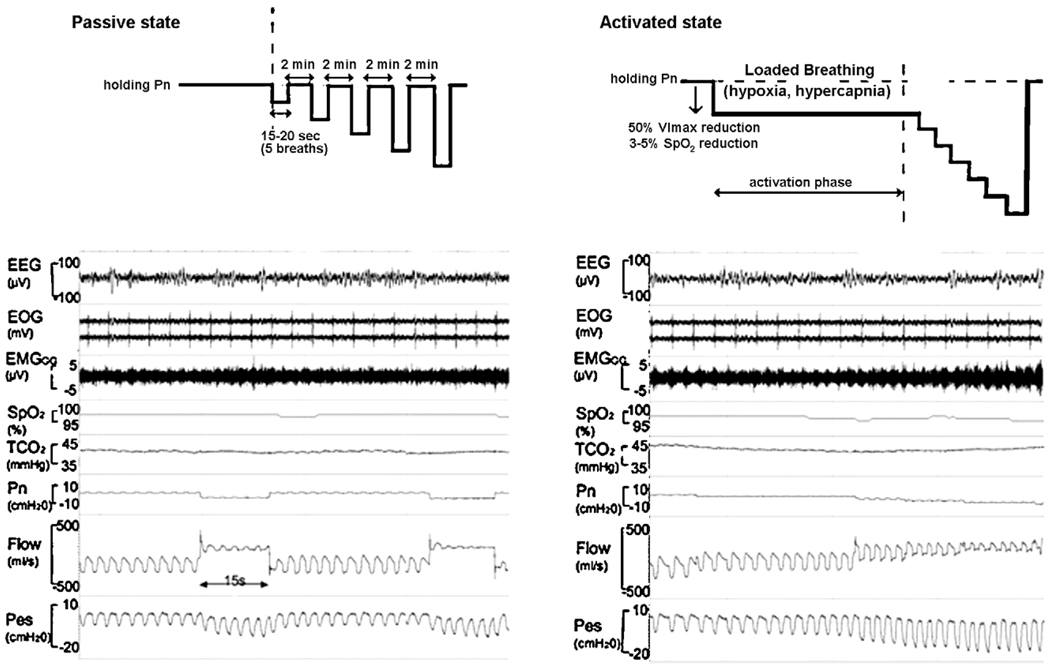
Fig. 2.
A schematic of the experimental protocol for producing upper airflow obstruction in the passive state (shown at the left) and in the active state (shown at the right). The polysomnographic recording in a one subject in passive and active condition is shown electroencepalogram (EEG), electroocculograms (EOG), intramuscular genioglossus electromyogram (EMGGG), oxyhaemoglobin saturation (SpO2), transcutaneous carbon dioxide (TcCO2), nasal mask pressure (PN), pnuemotach airflow (Flow), and eosophageal pressure (PES).
In the passive condition, PN is abruptly reduced from an elevated holding pressure to a level that induced airflow limitation (plateau in airflow with increasing esophageal pressure). Note that the drop in PN from holding pressure to lower pressure levels decreases the flow.
In the active condition, a stable unobstructed breathing pattern was initially maintained at a positive holding pressure. Thereafter, PN was lowered by 2 cm H2O steps until a quasi-steady state flow limited breathing pattern associated with a 40–50% reductions in V̄I max (“activation phase”) was achieved. This level of airflow obstruction was maintained for 2 min during which genioglossal EMG activity rose, and SpO2 fell by 3–5% and TcCO2 increased by 5–10 mmHg above baseline (accounting for a 5–10s delay in TcCO2). Subsequently, PN was lowered in a stepwise fashion by 2 cm H2O every 5 breaths until zero flow was obtained or SpO2 reached a lower limit of 88–90%.

