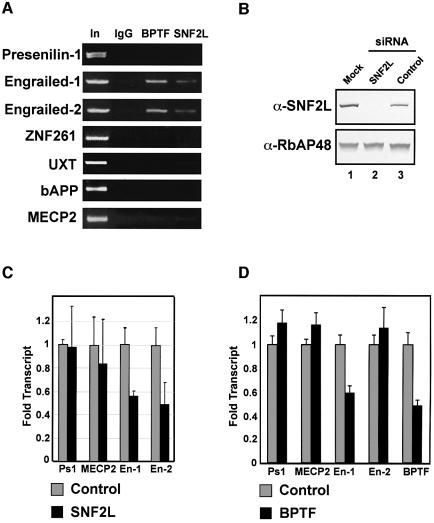
Fig. 7. hNURF localizes to and regulates human Engrailed. (A) ChIP assays localize hNURF specifically to engrailed-1 (en-1) and engrailed-2 (en-2) promoters. Chromatin from HEK293 cells was subjected to formaldehyde cross-linking followed by sonication and immunoprecipitation with non- specific, BPTF and SNF2L antibodies. After extensive washes, bound DNA was eluted and subjected to PCR with the indicated promoter primers. A specific and reproducible signal at the engrailed promoters comparable with input (In) was detected in the BPTF and SNF2L IPs but not in the non-specific IgG. Input fractions represent 1% of the total IP. Multiple primer pairs from each promoter were employed. Non-specific promoters include presenilin-1, znf261, UXT, APP and MECP2 as indicated. A representative set is displayed. (B) siRNA-mediated depletion of SNF2L. HEK293 cells transfected with either mock, SNF2L-specific siRNAs or non-specific siRNAs. Extract from cells 72 h after transfection were prepared and separated by SDS–PAGE followed by western analysis for SNF2L levels. The SNF2L-specific siRNA depletes SNF2L to undetectable levels compared with mock and non-specific siRNAs (compare lane 2 with lanes 1 and 3, top panel). Lower panel: loading control for protein levels determined by RbAP48 levels. (C) Depletion of SNF2L leads to a significant decrease in en-1 and en-2 transcripts. Total RNA was extracted from SNF2L-depleted and control HEK293 cells and subjected to reverse transcription followed by real-time PCR. Levels of transcripts were quantified and normalized to β-actin levels using the ABI7000 sequence detection system. Genes lacking hNURF at their promoters as determined by ChIP were used as controls. The bar graph depicts the average of three independent experiments. Standard errors are indicated. (D) Depletion of BPTF leads to a significant decrease in en-1 transcript. Experiments were performed as in (C). The bar graph depicts the averages of three independent experiments. Standard errors are indicated.

An official website of the United States government
Here's how you know
Official websites use .gov
A
.gov website belongs to an official
government organization in the United States.
Secure .gov websites use HTTPS
A lock (
) or https:// means you've safely
connected to the .gov website. Share sensitive
information only on official, secure websites.
