
Fig. 4. Structural basis of inhibition by Stl: modeled interactions with transcription elongation complex.
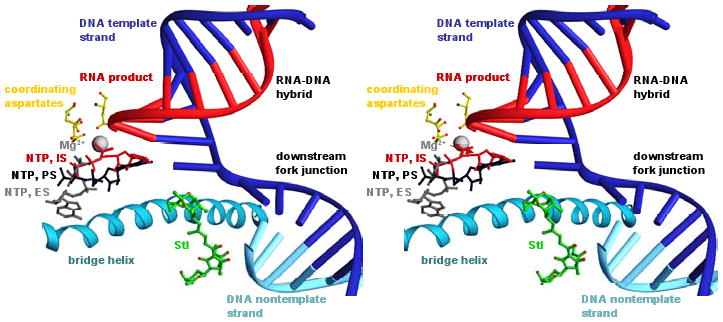
Modeled structure of transcription elongation complex containing Stl. To model positions of the DNA template strand, the DNA nontemplate strand, and the RNA product (blue, cyan, and red nucleic acids), nucleic acids from a structure of the yeast RNAPII transcription elongation complex (Kettenberger et al. 2004; PDB accession 1Y1W) were built into the structure of RNAP-Stl (superimposition based on Cα atoms of residues 482, 822, and 829 of yeast RNAPII RPB1 and Cα atoms of residues 740, 1079, and 1086 of T. thermophilus RNAP β′). To model positions of an NTP at the insertion-site, IS, an NTP at the entry site proposed in Westover et al. 2004a, ES, and an NTP at the pre-insertion site proposed in Kettenberger et al. 2004, PS (red, gray, and black NTPs), NTPs from structures of yeast RNAPII transcription elongation complexes containing bound NTPs (Westover et al., 2004a; Kettenberger et al. 2004; PDB accessions 19RS, 1R9T and 1Y77) were built into the structure (superimposition as above).