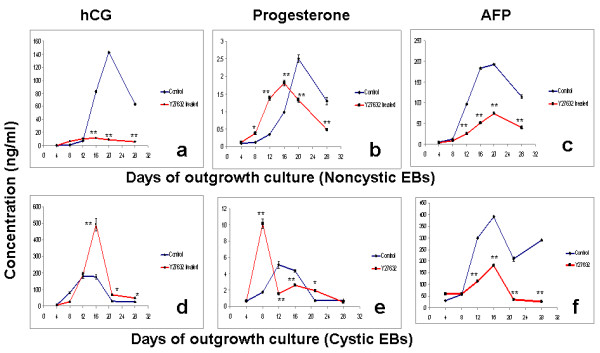
Figure 2.

Secretion of trophoblast and lineage markers. Graphs (a), (b) and (c) indicates secretion of hCG, progesterone (P2) and AFP from control and Y27632 treated outgrowth cultures from non-cystic early day 10 EBs. Graphs (d), (e) and (f) indicates secretion of hCG, progesterone (P2) and AFP from control and Y27632 treated outgrowth cultures from cystic late day 30 EBs. The values are represented as mean ± SD. Level of secretion in the treated cultures are marked by (*) and (**) to indicate significant (P < 0.05) and highly significant (P < 0.005) differences as compared to the control.
