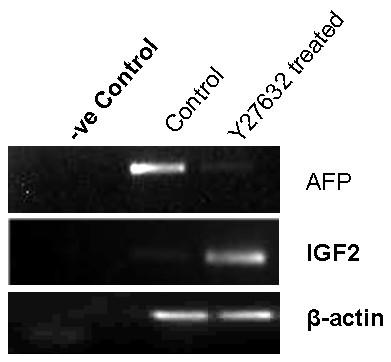
Figure 3.

Semiquantitative RT-PCR comparing the level of expression of AFP and IGF2 mRNA in control and Y27632 treated cytic EB cultures on day 16. The expression of AFP was seen to be stronger in the control (very faint band) as compared to treated cultures. However, expression of IGF2 a characteristic of trophoblast cells was seen to be stronger in the treated as compared to the control (faint band). The expression of β-actin was similar in both control and treated samples.
