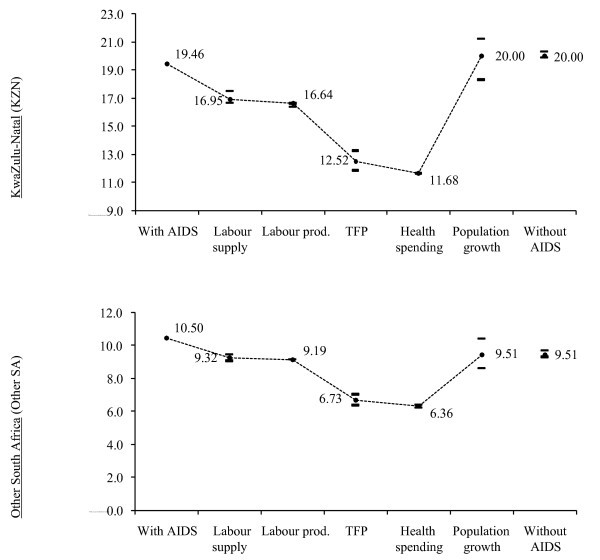
Figure 1.

Channels' impact on final year poverty rate, 2025. Source: Provincial DCGE model results. Note: Outcomes are cumulative (for example, labour productivity includes the outcomes from labour supply). Horizontal bars show upper and lower bounds after assuming a 20% confidence interval around the additional growth rate resulting from each impact channel.
