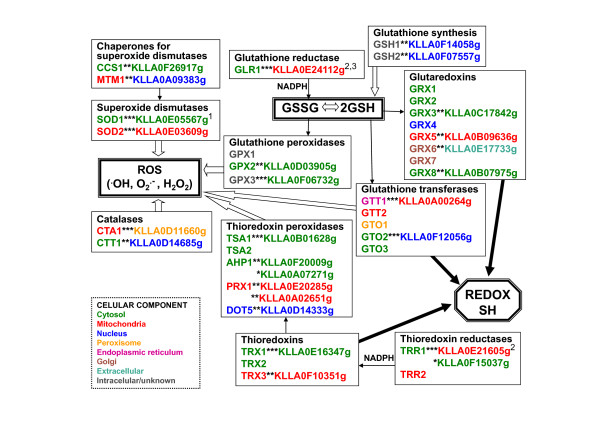
Figure 2.
Putative oxidative stress response Kluyveromyces lactis sequences and their Saccharomyces cerevisiae counterparts. Similarity of the proteins (*** = highly similar ** = similar * = weakly similar). For K. lactis proteins, the cellular location indicated corresponds to the highest probability estimated by WoLF PSORT [36], and for S. cerevisiae proteins to the first location mentioned in SGD (Saccharomyces Genome Database); N = reference for cloning/expression of the K. lactis gene: 1 [37], 2 [31], 3 [28]. See also Additional File 1.

