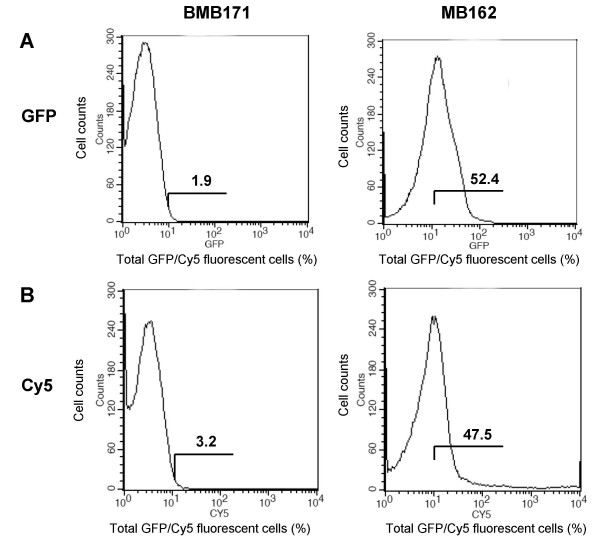
Figure 4.
Flow cytometric analysis of B. thuringiensis BMB171 and MB162 cells. Cells were labelled with primary monoclonal anti-GFP antibody, followed by secondary Cy5-conjugated goat anti-mouse IgG. The value of each histogram indicates the percentage of total GFP/Cy5-labelled fluorescent cells. For each experiment, 100,000 cells were analyzed.

