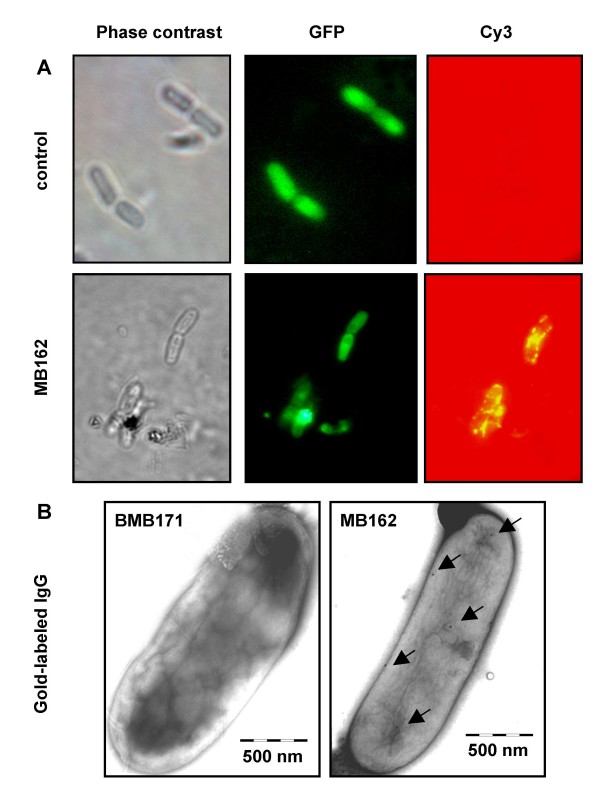
Figure 5.
Microscopic observation of B. thuringiensis MB162 cells expressing Mbg-GFP and control cells expressing cellular GFP. For immunofluorescence microscopy (A), cells were treated with anti-GFP monoclonal antibody and followed with goat anti-mouse Cy3-conjugate antibody. Panels show the images observed by phase contrast microscopy and fluorescence microscopy using green and red emission filters. For immunochemical electron microscopy (B), the samples were further treated with 10 nm colloidal gold-conjugated goat anti-mouse IgG. Arrows indicate the gold particles. The scale bars represent 500 nm.

