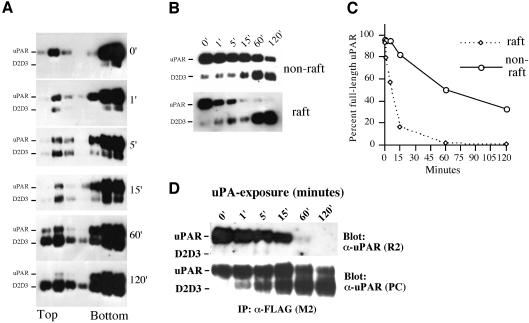
Fig. 6. uPA-mediated uPAR cleavage is accelerated in lipid rafts. (A) 293/uPAR cells were treated for various times (0, 1, 5, 15, 60 and 120 min) at 37°C with 3 nM uPA in DMEM supplemented with 0.1% BSA. After the incubation, cells were moved to ice, washed in ice-cold PBS, lysed in Triton X-100 containing buffer, and subjected to flotation analysis as described above. uPAR and cleaved uPAR (D2D3) were identified by immunoblotting analysis using a polyclonal anti-uPAR antibody. (B) Flotation fractions corresponding to the raft and non-raft material were pooled, aliquots were reduced and deglycosylated, fractionated by SDS–PAGE and immunoblotted with a polyclonal anti-uPAR antibody. (C) The intensity of the bands corresponding to full-length uPAR in (B) was quantified by densitometry and plotted as a percentage of the intensity observed in cells not exposed to uPA (0 min). The data represents the mean value of two independent experiments. (D) Lysates of 293/uPAR cells exposed to uPA (3 nM) for different lengths of time were immunoprecipitated with M2 and blotted with R2 to reveal the co-immunoprecipitated uPAR, or with a polyclonal anti-uPAR antibody to reveal total uPAR.

An official website of the United States government
Here's how you know
Official websites use .gov
A
.gov website belongs to an official
government organization in the United States.
Secure .gov websites use HTTPS
A lock (
) or https:// means you've safely
connected to the .gov website. Share sensitive
information only on official, secure websites.
