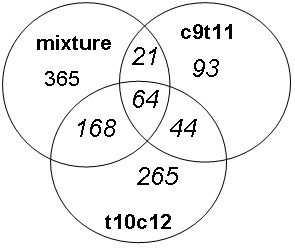
Figure 1.

Distribution of the gene transcripts (n = 1020) regulated more than +/- 1.5 fold after the various interventions compared to linoleic acid control as assessed by whole genome gene expression microarray U133 2.0 Plus GeneChip. Intersections show genes regulated by more than one treatment.
