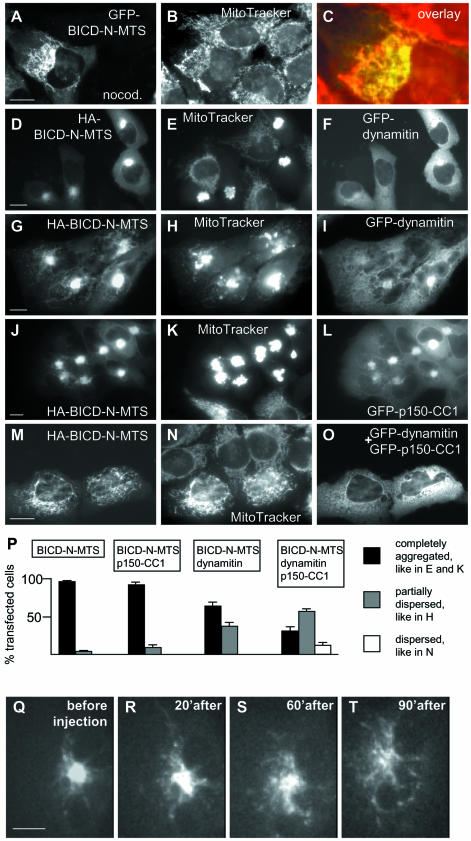
Fig. 6. Effect of dynein-inhibiting agents on the mitochondrial aggregation, caused by the BICD-N–MTS fusion. (A–C) HeLa cells were transfected with GFP-BICD-N-MTS (A), stained with MitoTracker (B) and treated with 10 µM nocodazole 1 h before fixation. An enlarged portion of the overlay (GFP signal in green, mitochondria in red) is shown in (C). (D–O) HeLa cells were cotransfected with the indicated constructs, stained with MitoTracker, fixed and stained for HA-tag. Anti-HA staining is shown in the left panels, MitoTracker in the middle panels and GFP signal in the right panels. Bar, 10 µm. (P) Quantitative analysis of the transfection results, shown in (D–O). For each cotransfection, three independent experiments were performed, and 100 cells were counted for each experiment. Only cells which had a healthy, spread appearance and expressed medium levels (5–10 times compared with the endogenous BICD2 levels, as determined by counterstaining with anti-BICD2 antibodies), were scored. Percentage of transfected cells, displaying the indicated phenotype is shown; standard deviations are indicated. (Q–T) CAR fish fibroblast, transfected with GFP-BICD-N-MTS, was microinjected with M74–2 antibody against dynein intermediate chain. GFP signal before and at different time intervals after transfection is shown. Bar, 10 µm.

An official website of the United States government
Here's how you know
Official websites use .gov
A
.gov website belongs to an official
government organization in the United States.
Secure .gov websites use HTTPS
A lock (
) or https:// means you've safely
connected to the .gov website. Share sensitive
information only on official, secure websites.
