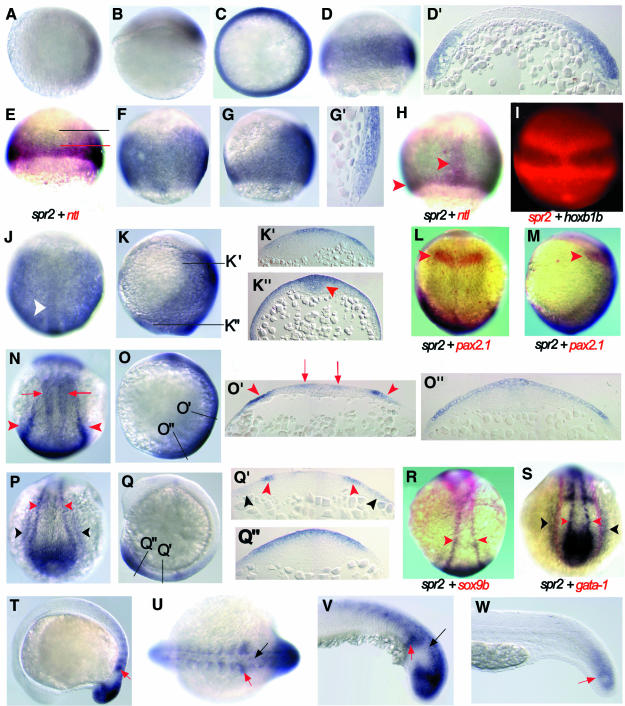
Fig. 2. Expression pattern of spr2 during the development of zebrafish embryos. Animal-pole (A) and lateral (B) views of an embryo with dorsal to the right at 30% epiboly stage. Animal-pole (C) and lateral (D) views of a shield-stage embryo with dorsal to the right. (D′) A section in parallel to the animal–vegetal plane of the embryo in (D). Embryos simultaneously labeled for ntl (red) and spr2 (blue) at 50% epiboly (E) and 75% epiboly (H). The upper limit of ntl and spr2 domains in (E) is indicated by red and black lines, respectively. The red arrowheads in (H) point at the axial and germ ring domains of ntl. (F, G and G′) Embryos at 75% epiboly. (F) Dorsal view. (G) Lateral view with dorsal to the right. (G′) The shield area of a section along the anteroposterior axis. (I) Fluorescence-microscopic dorsal view of a 60% epiboly-stage embryo simultaneously labeled for hoxb1b (blue/black) and spr2 (red). Dorsal (J) and lateral (K) views at 95% epiboly. The white arrowhead in (J) points at the midline tissues with a higher level of expression, probably including the neural and the notochord precursors. (K′ and K′′) Cross-sections at positions indicated in (K). Expression occurred anteriorly in the outer layer of two to three cell-diameter and posteriorly in the thickening midline tissues (indicated by an arrowhead). Dorsal (L) and lateral (M) views of a bud-stage embryo simultaneously labeled for pax2.1 (red) and spr2 (blue), showing that the anterior border of spr2 domain matched the pax2.1 domain (posterior midbrain, indicated by arrowheads). Dorsal (N) and lateral (O) views of a two-somite stage embryo. (O′ and O′′) Cross-sections at positions indicated in (O). The red arrowheads indicate the posterior border of the neuroectoderm [trunk neural crest (TNC) precursors] and red arrows indicate unidentified neural precursors. (P–S) Emryos at the six-somite stage. (P) Dorsal view of posterior trunk. (Q) Lateral view. (Q′ and Q′′) Cross-sections at positions indicated in (Q). (R) Double staining for sox9b (red) and spr2 (blue). Both genes were expressed in the TNC cells. (S) Double staining for gata-1 (red) and spr2 (blue). The outermost domain (lateral mesoderm) of spr2 partially overlapped the gata-1 domain (hematopoietic progenitors). Red arrowheads in (P–S) point at the TNC and black arrowheads at the lateral mesoderm. Lateral (T) and posterodorsal (U) views at 14-somite stage. Lateral views of posterior trunk at 18-somite stage (V) and 24 h (W). The red and black arrows indicate the newly formed somites and neuronal cells.

An official website of the United States government
Here's how you know
Official websites use .gov
A
.gov website belongs to an official
government organization in the United States.
Secure .gov websites use HTTPS
A lock (
) or https:// means you've safely
connected to the .gov website. Share sensitive
information only on official, secure websites.
