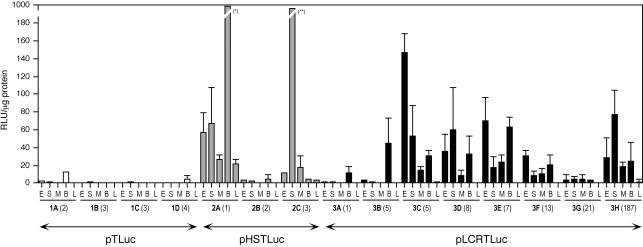
Figure 3.
Analysis of boundary function of mouse tyrosinase LCR sequences in transgenic mice. Analysis of luciferase activity in transgenic mice generated with pTLuc (four lines, 1A to 1D, white bars), pHSTLuc (three lines, 2A to 2C, grey bars) and pLCRTLuc (eight lines, 3A to 3H, black bars), as shown in Figure 1D. Each bar represents the mean value of six adult individuals (±SD) in protein extracts from: eye (E), dorsal skin (S), skeletal muscle (M), brain (B) and liver (L). Transgene copy number is indicated, in parentheses, for each line. Luciferase activity is expressed as relative light units (RLU) per microgram of protein. Values that exceed this scale: (*) 979.52 ± 196.3 and (**) 223.04 ± 154.8 RLU/µg protein.

