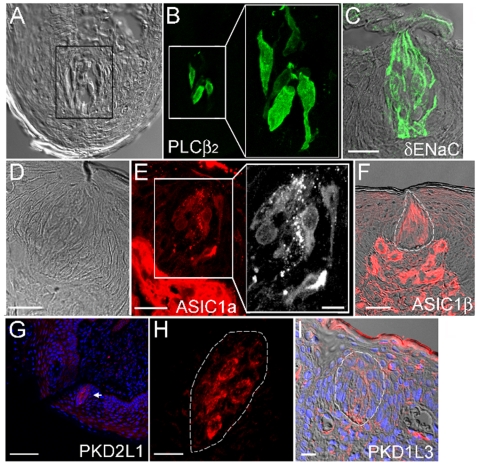
Figure 5. Immunohistochemical staining of the protein products of taste-related genes expressed in the fungiform papillae of sour-normal subjects.
The gray image of Panel A is a fungiform section showing taste buds under Nomarski optics. The image in Panel B is of the same section as A, but showing the section immunostained with antibodies to PLC-β2. Panel C displays immunostaining with antibody to δ-ENaC, overlaid on a Nomarski picture of the same tissue section. The human taste bud is known to be invested with the δ form of ENaC at the expense of the α form [36]. Panel E shows immunoreactivity to antibody against ASIC1a, with the Nomarski optics of the same section displayed in Panel D. The taste bud area of the section in Panel E is magnified to a larger black and white image showing the specific labeling of the characteristic spindle-shaped cells within a taste bud. Panel F shows immunoreactivity to antibody against ASIC1β in the taste bud (outlined) and in the plexus, overlaid on a photo of the same section under Nomarski optics. The distribution of the channels PKD2Ll and PKD1L3 in the human fungiform papilla is shown in Panels G, H and I. Panels G and H display immunoreactivity toward the ion channel PKD2L1. A DAPI overlay marks each cell. The arrow in Panel G points to a taste bud. This taste bud appears in Panel H at an approximately five-fold magnification. Note the labeling of the membranes of several taste cells. Panel I shows distribution of immunoreactivity to an antibody made against PKD1L3. It shows the upper portion of a human fungiform papilla using Nomarski optics overlaid with the immunohistochemical label from an antibody against PKD1L3 and DAPI stain. A taste bud is outlined. The label for PKD1L3 appears between cells and is likely not labeling the membrane of the taste bud cells because the label does not appear in the cells, as it would were the antibody recognizing an antigen on the taste cell. The bars on each Panel show the magnification: A & B: the box width is 40 µm, blow-up in Panel B is a 2-fold magnification of the left smaller box; C: 20 µm; D & E: 25 µm with Insert E: 10 µm; F: 25 µm; G: 80 µm; H: 15 µm; I: 15 µm.

