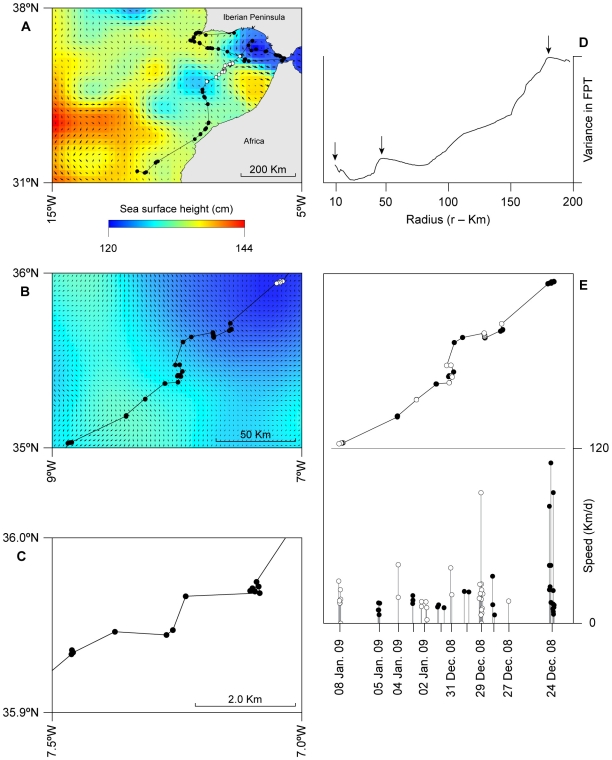
Figure 2. Multi-scale track analysis.
(A) Large-scale movement of sunfish S3 in relation to 1/4° altimetry map, depicting averaged mesoscale eddies and geostrophic current direction and speed vectors in the Gulf of Cadiz for the period between 6 November 2008 and 6 February 2009. (B) Track section for the period between 24 December 2008 and 8 January 2009 overlaid on the 1/32° global Naval Research Laboratory Layered Ocean Model (NLOM) SSH data for the same period; white dots in (A) denote the track section shown in (B), and those in (B) are shown in (C) to illustrate the similar patterns in movement at three distinct scales. (D) Variance in first passage times show peaks (arrowed) corresponding to the scales shown in (A–C). (E) Track section illustrating intermittent movement rate over successive days (top panel; white and black circles denote different consecutive days) and variation in over the ground speeds. Minimum time interval between consecutive locations, 4 min.

