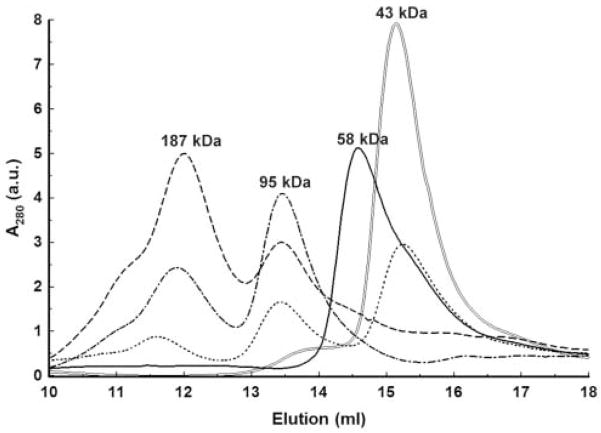
Figure 8. Gel-filtration of Eco31I and its complexes with DNA.
The numbers above the peaks denote the apparent molecular mass values, calculated by interpolating measured elution volumes onto the calibration curve. a.u. – arbitrary units. ‘—’ elution of free Eco31I; ‘=’ elution of free DNA; ‘■ ■ ■ ■’ elution of Eco31I-DNA (0.25–0.5 μM) complex; ‘- ■ -’ elution of Eco31I-DNA (1.0–0.5 μM) complex; ‘- - -’ elution of Eco31I-DNA (2.0–0.5 μM) complex.

