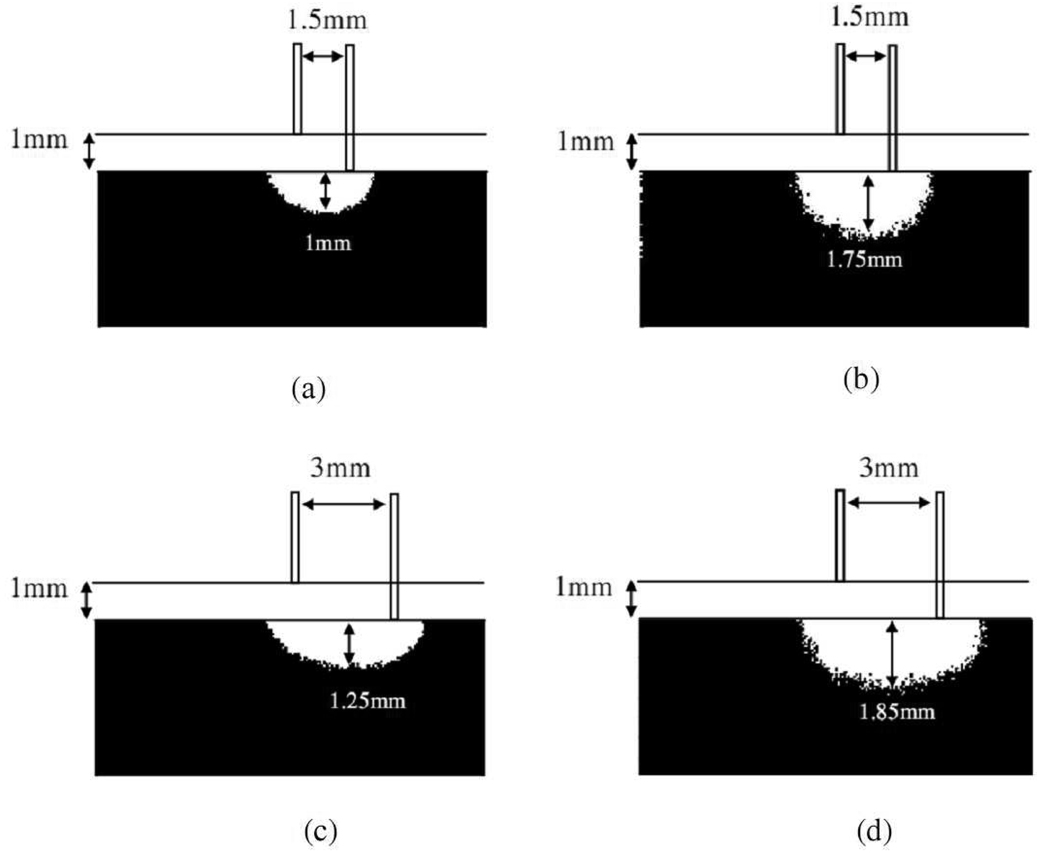
Fig. 4.
50% threshold maps for the diffusing probe of 1.5mm source-detector separation with (a) 500nm light source and (b) 900nm light source, and for the diffusing probe of 3mm source-detector separation with (c) 500nm light source and (d) 900nm light source. White region in the tissue sample represents the area that has top 50% fluence rate. Please refer to text for the parameters used.

