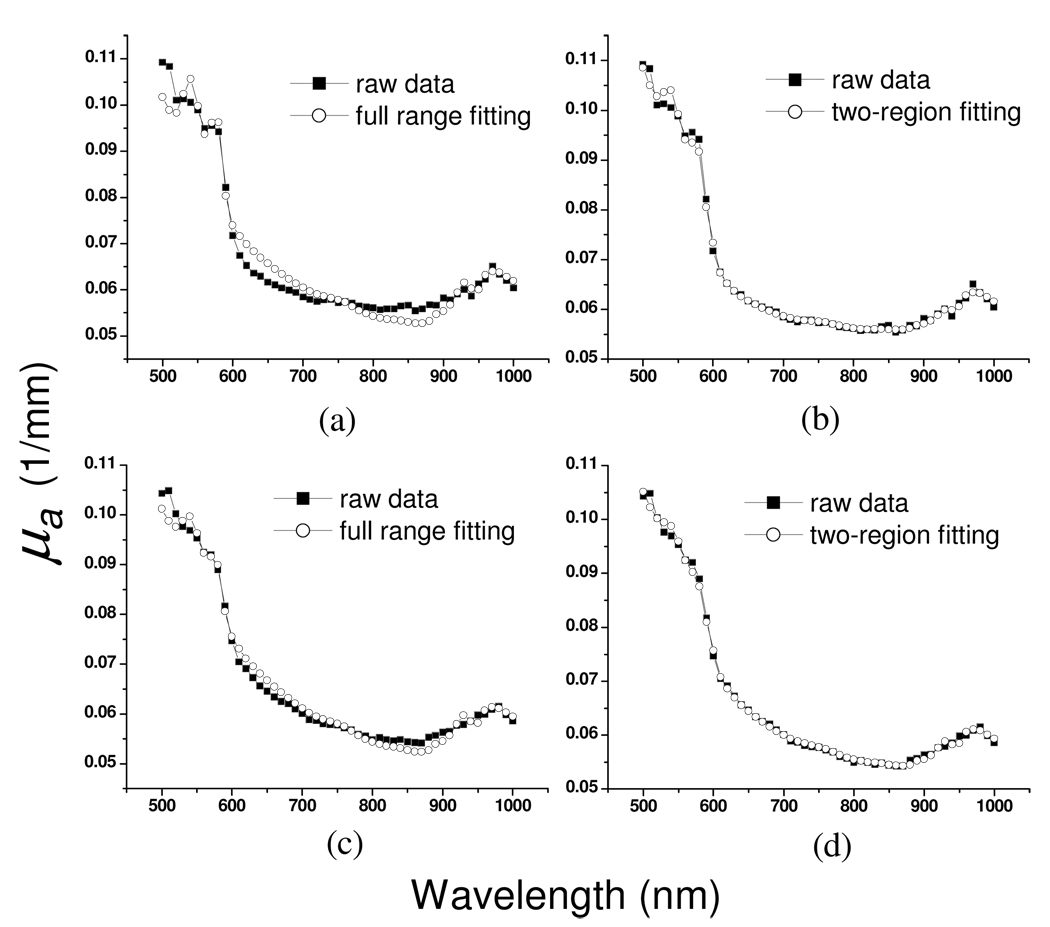
Fig. 8.
Two typical chromophore fitting examples with full range fitting method and two-region fitting method. (a) and (b) demonstrate the fitting results of two fitting methods with the same raw data. (c) and (d) demonstrate another example. Solid squares represent raw data and open circles represent fit spectra.

