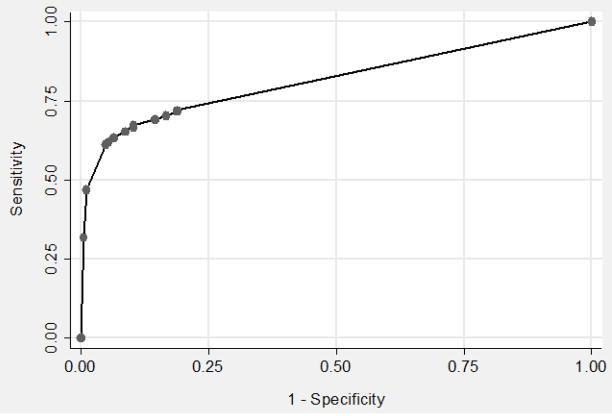
Figure 2. Receiver Operating Characteristic (ROC) curve for Fluorescence Microscopy (FM).
The sensitivity and specificity of FM at different smear positive thresholds was assessed using ROC analysis. The points on the graph from left to right represent thresholds of 1 through 9 acid-fast bacilli (AFB) per length followed by 1+, 2+ and 3+ FM smear results. Maximum area under the curve (0.82, 95% CI 0.78– 0.85) was obtained at a threshold of > 4 AFB/100 fields and resulted in a sensitivity of 68% and specificity of 90%.

