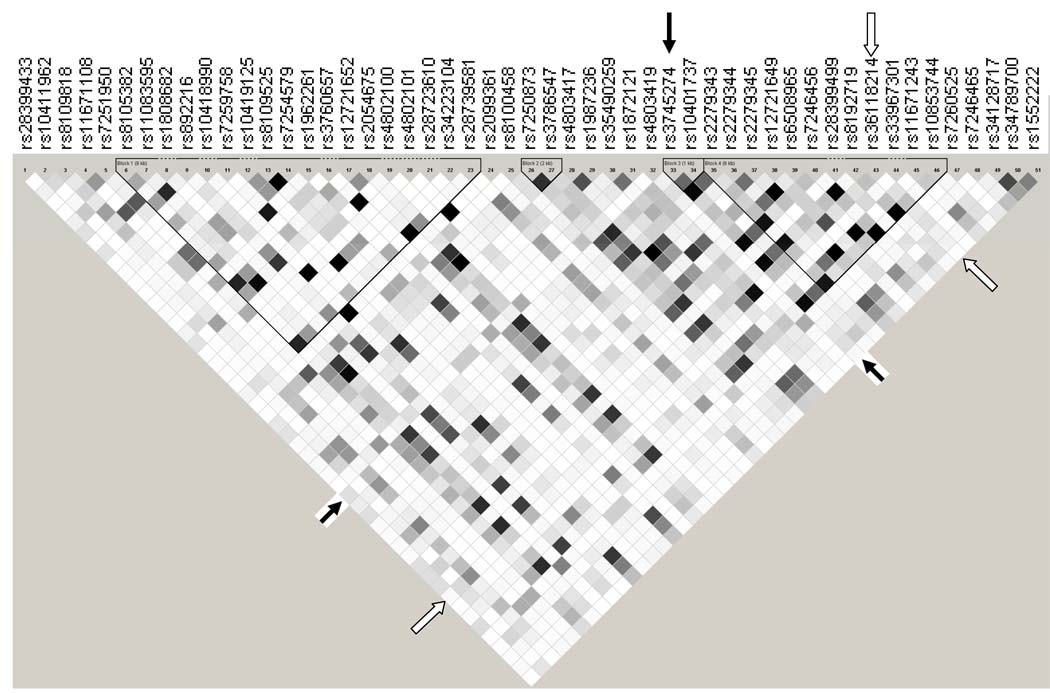
Figure 1.
Linkage disequilibrium (LD) plot of CYP2B6 polymorphisms. Data from the 45 participants are included. Black, r2 = 1; shades of grey 0 < r2 < 1; white, r2 = 0. The plot was generated using Haploview [24]. Solid arrows indicate the CYP2B6 516G→T (rs3745274) polymorphism. Open arrows indicate rs36118214. The CYP2A6 promoter polymorphism (rs28399433) is also included at far left. Four LD blocks are shown.

