
Fig. 2.
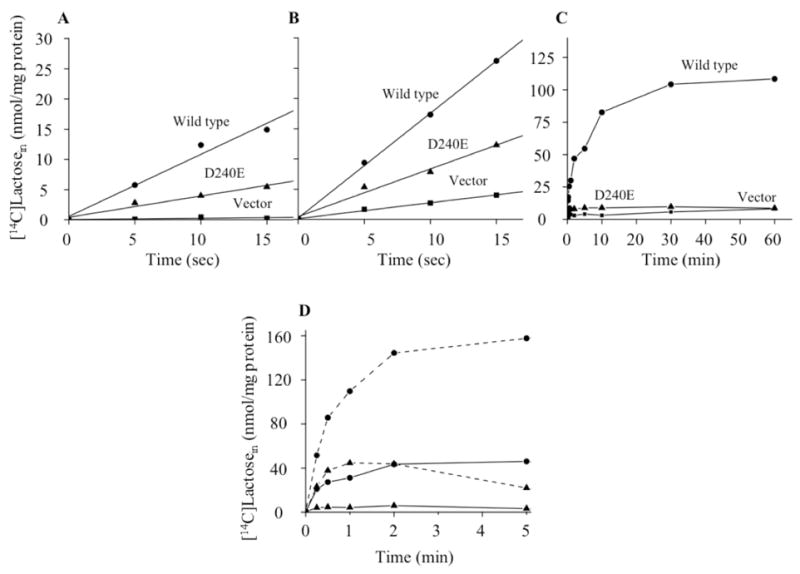
Lactose active transport. A & B). Initial rates of lactose transport for E. coli T184 (ΔlacZY) or HB101 (lacZ+Y−) intact cells, respectively. C). Time course of lactose accumulation for E. coli T184 intact cells. D). Active transport by RSO membrane vesicles prepared from E. coli T184 expressing wild-type or D240E LacY. E. coli T184 or HB101 intact cells containing wild type(λ), mutant D240E (σ) or empty vector (ν) were adjusted to an OD420 of 10.0 (0.7 mg protein/ml). Transport was carried out with [14C]lactose (10 mCi/mmol) at a final concentration of 0.4 mM (solid line). The intracellular lactose concentration is plotted as a function of time. Lactose transport in RSO membrane vesicles in Panel D was assayed at a protein concentration of 3.5 mg/ml in the presence of 20 mM ascorbate/0.2 mM phenazine methosulfate under oxygen with [14C]lactose at a final concentration of 0.4 mM (10 mCi/mmol; solid line) or 4.0 mM (2.5 mCi/mmol; dashed line) as described in Experimental Procedures. The intravesicular lactose concentration after correction for RSO vesicles transformed with empty vector is plotted as a function of time.