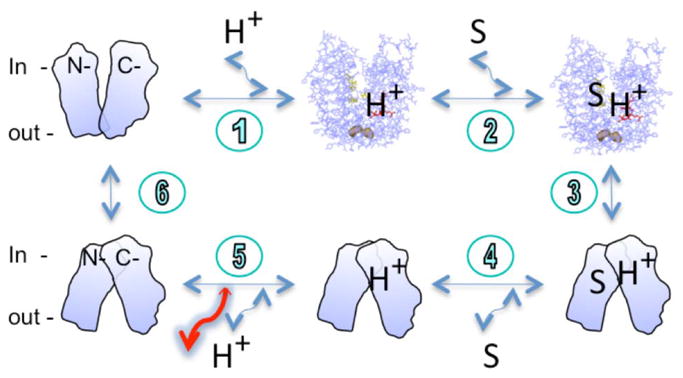
Fig. 6.

A kinetic model for lactose efflux. Two X-ray crystal structures without (PDB 2v8n) or with bound sugar (PDB 1pv7) represent the inward-facing conformation. The sugar substrate is shown as the capital letter S. Both N- and C-termini are indicated. The orientation of the membrane is marked as in or out. The closest residues, Ile32 (helix I) and Asn245 (helix VII), between two helices bundles are shown in surface model and light brown color. The larger red arrow indicates that step 5 may be enhanced in the D240E mutant.
