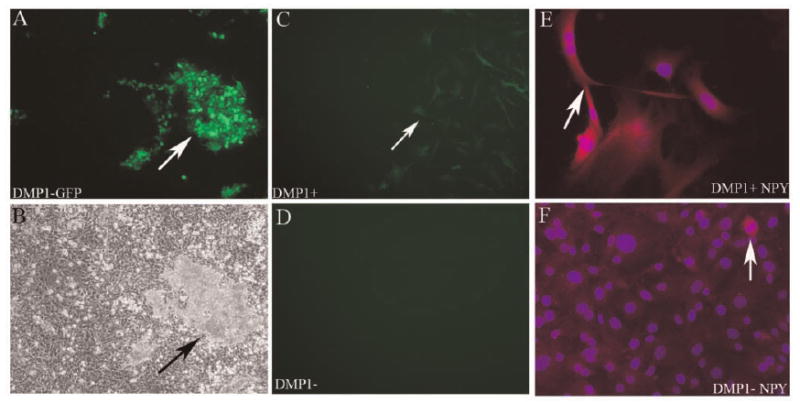
Fig. 3.

Detection of NPY protein by immunofluorescence. A,B: DMP1-GFP expression in mouse calvarial osteoblast cell cultures at day 16 prior to cell sorting under epifluorescence (A) and phase contrast (B). C: Epifluorescent image of DMP1+ cells after sorting. D: Epifluorescent imaging shows no GFP expression in DMP1− cells following sorting. E: DMP1+ cells and (F) DMP1− cells immunostained for NPY (red, TRITC+), and nuclear staining (blue, DAPI). A strong immunoreactivity was observed in DMP1+ cells (E), while a lower but detectable expression was observed in DMP1− cells (F).
