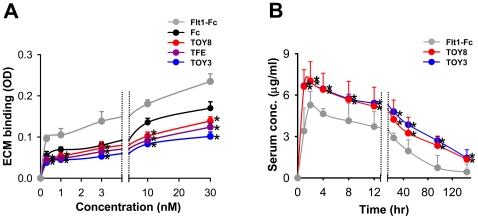
Figure 5. TOY3 and TOY8 have low binding affinity to ECM in vitro and display excellent pharmacokinetic profiles in vivo.
(A) ELISA analysis depicting the binding affinity for different concentrations (0.3, 1, 3, 10, 30 nM) of each indicated protein to ECM. Values are given as means ± S.D. (n = 4). *, P<0.05 versus Fc. (B) Pharmacokinetic profiles. The indicated protein (5 mg/kg) was injected intraperitoneally into C57BL/6 mice. Then blood samples were taken from the tail vein at 1, 2, 4, 8, 12, 24, 48, 96, and 144 hrs, and serum levels of the proteins were measured by ELISA. Values are given as means ± S.D. (n = 4). *, P<0.05 versus Fc.

