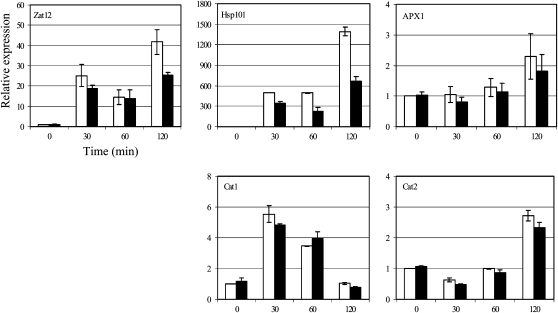
Figure 9.
The SOR lines had lower heat-induced transcript (Hsp101) and delayed induction of Zat12. Expression levels of genes encoding ROS-sensitive proteins (Hsp101 and Zat12) and ROS-scavenging enzymes (APX1, Cat1, and Cat2) were detected by quantitative RT-PCR. The raw data (cycle threshold values) were normalized using Actin2/8 as an internal control. White bars indicate the wild type and black bars indicate the SOR3 line. The experiment was reproduced at least twice.

