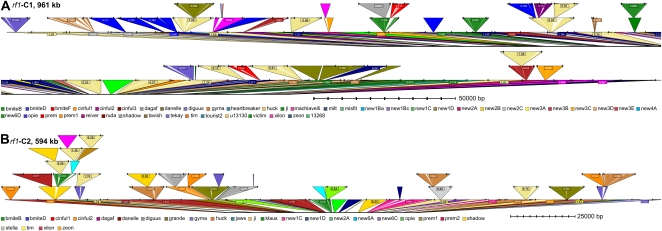
Figure 3.
TEnest graphical display of maize sequence contigs. A, TEnest insertion display output of the rf1-C1 961-kb maize contig, split into two sections. B, TEnest insertion display output of the rf1-C2 594-kb maize contig. TEs are shown as triangles inserted into the black DNA line. The TE families are shown below (for detailed display, see Supplemental Fig. S1).

