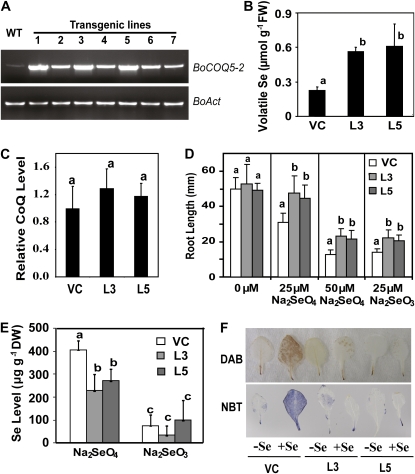
Figure 7.
Analysis of BoCOQ5-2 transgene levels, volatile Se content, ubiquinone level, and Se tolerance in transgenic Arabidopsis. A, Semiquantitative reverse transcription-PCR assay of BoCOQ5-2 transcript level in independent transgenic Arabidopsis lines. Expression of ACTIN (BoAct) was used as an internal control. B, GC-MS analysis of DMSe contents in transgenic Arabidopsis exposed to 50 μm Na2SeO3 for 3 d. C, Relative ubiquinone levels in transgenic Arabidopsis. D, Root length of transgenic Arabidopsis seedlings grown for 12 d on MS medium supplied with or without Se as indicated. E, Total Se accumulation. Transgenic Arabidopsis was treated with 50 μm Na2SeO3 for 3 d. Data represent means (n = 10) ± sd. F, In situ detection of ROS by DAB and NBT staining of representative leaves after exposing the transgenic plant to 25 μm Na2SeO3. The brown and purple precipitations indicate the production of ROS. Data are means of three repeats. Lowercase letters above the bars indicate significant differences (P < 0.05). DW, Dry weight; FW fresh weight; L3 and L5, transgenic line 3 and line 5; VC, vector-only control; WT, wild type. [See online article for color version of this figure.]

