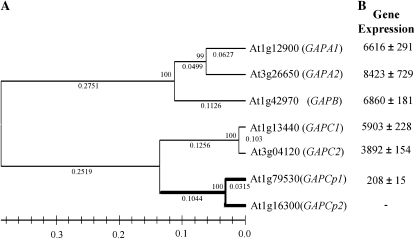
Figure 2.
Phylogenetic tree of the Arabidopsis phosphorylating GAPDH proteins, and gene expression levels. A, The phylogenetic tree was constructed from an alignment of deduced amino acid sequences as described in “Materials and Methods.” The bootstrap value from 100,000 replicates is given at each node. The scale shows the length of the maximum possible bootstrap value (100). Branch length is given under each segment according to the algorithm specified in “Materials and Methods.” B, Gene expression levels of the Arabidopsis GAPDH isoforms based on microarray experiments performed on 15-d-old seedlings.

